

Question: hi i need help with p value and test statistic According to the N.Y. Times Almanac the mean family size in the U.S. is 3.18.
hi i need help with p value and test statistic
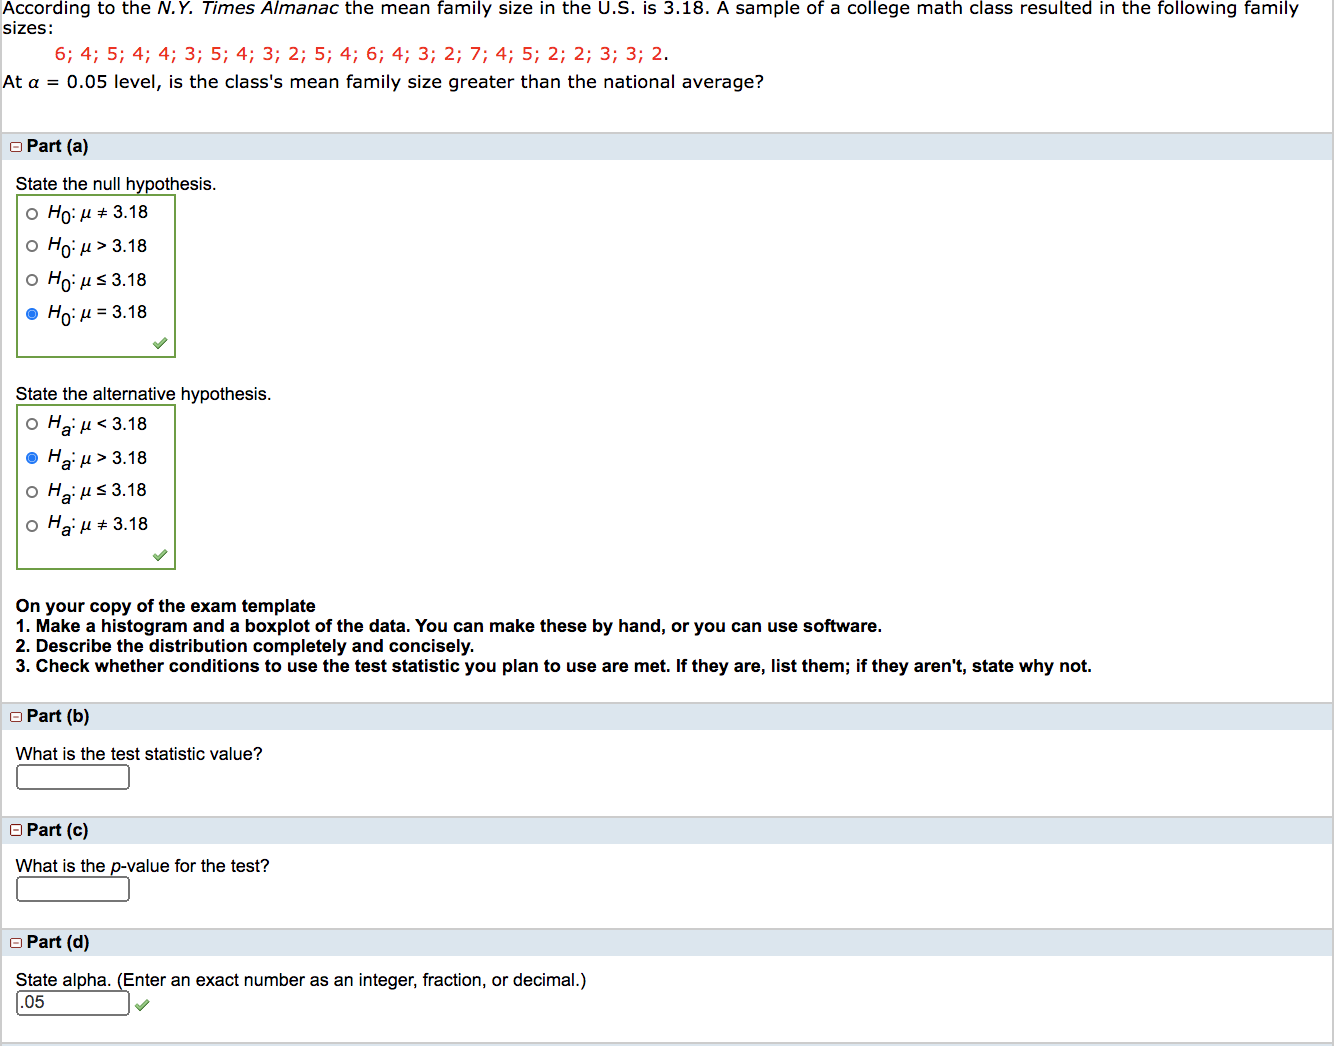
According to the N.Y. Times Almanac the mean family size in the U.S. is 3.18. A sample of a college math class resulted in the following family sizes: 6; 4; 5; 4; 4; 3; 5; 4; 3; 2; 5; 4; 6; 4; 3; 2; 7; 4; 5; 2; 2; 3; 3; 2. At a = 0.05 level, is the class's mean family size greater than the national average? Part (a) State the null hypothesis. O Ho: H + 3.18 O Ho: H > 3.18 O Ho: MS 3.18 . Ho: H = 3.18 State the alternative hypothesis. O Hail 3.18 O Hai US 3.18 O Hail + 3.18 On your copy of the exam template 1. Make a histogram and a boxplot of the data. You can make these by hand, or you can use software. 2. Describe the distribution completely and concisely. 3. Check whether conditions to use the test statistic you plan to use are met. If they are, list them; if they aren't, state why not. Part (b) What is the test statistic value? Part (c) What is the p-value for the test? Part (d) State alpha. (Enter an exact number as an integer, fraction, or decimal.) .05
Step by Step Solution
There are 3 Steps involved in it

Get step-by-step solutions from verified subject matter experts