

Question: Hi I need help with this problem if possible explain how to get the solution step by step on Excel as well in reference to
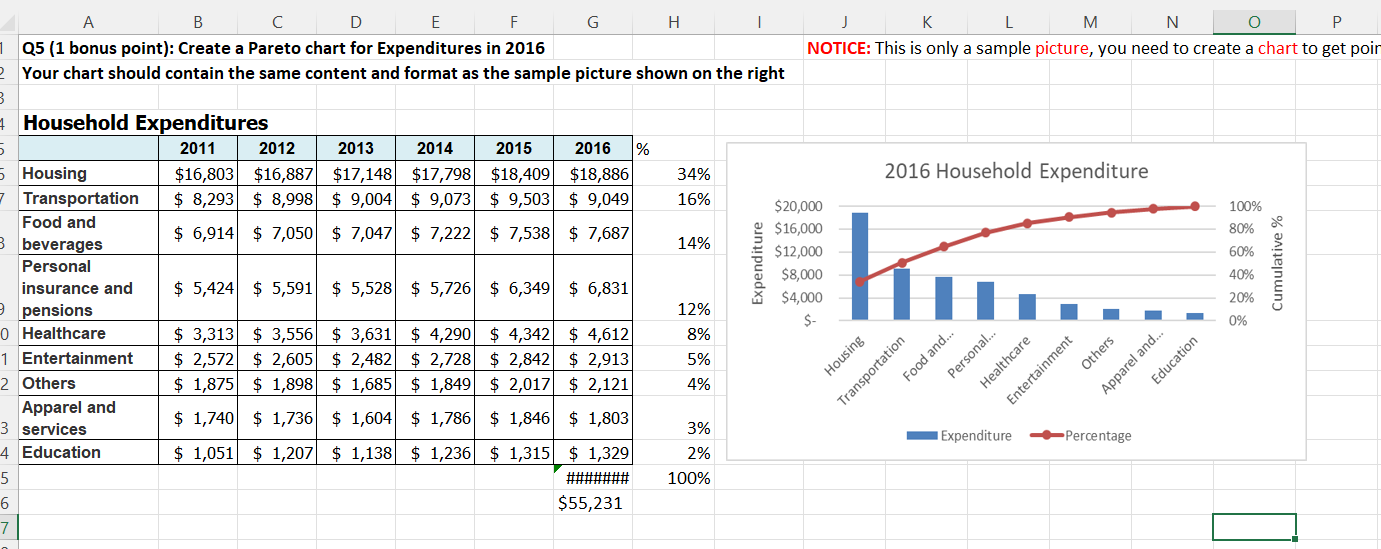 Hi I need help with this problem if possible explain how to get the solution step by step on Excel as well in reference to the $55,231 is the total of column 16 and next to it are its percentages,
Step by Step Solution
There are 3 Steps involved in it
1 Expert Approved Answer
Step: 1 Unlock

Question Has Been Solved by an Expert!
Get step-by-step solutions from verified subject matter experts
Step: 2 Unlock
Step: 3 Unlock