

Question: Hi, I need to answer this question by using python. Can you please help me in solving this problem? I provide the file of lab05c_prelim.py
Hi, I need to answer this question by using python. Can you please help me in solving this problem? I provide the file of lab05c_prelim.py below.
This is the file lab05c_prelim.py
#!/usr/bin/env python3 # -*- coding: utf-8 -*- """ ENGG1811, Lab 05, Part C. File for students
Date: 07/03/18, CTC """ # ############# DO NOT CHANGE THIS PART ######## # %% Import file import matplotlib.pyplot as plt
# %% # ########### DO NOT CHANGE THIS CELL ############ # Load data and convert to float # load the file that contains the sampling instants # create a list of time instants with open('time_data_complete.txt') as f: time_str_list = f.read().splitlines() f.close
# load file the contains the voltage measurements # create a list of voltage values with open('voltage_data_complete.txt') as f: voltage_str_list = f.read().splitlines() f.close
# convert to elements in the list to float data type time_list = [float(t) for t in time_str_list] voltage_list = [float(v) for v in voltage_str_list]
# Plot a graph of the data fig1 = plt.figure() # create a new figure plt.plot(time_list,voltage_list, '--x') plt.xlabel('time [s]') # label for x-axis plt.ylabel('voltage [V]') # label for y-axis plt.title('Pulse oximeter data') # title of the graph plt.grid() # display the grid plt.show() # to display the graph
# ########### DO NOT CHANGE THIS CELL ############
# %% Your solution ########### PUT YOUR SOLUTION BELOW ###########
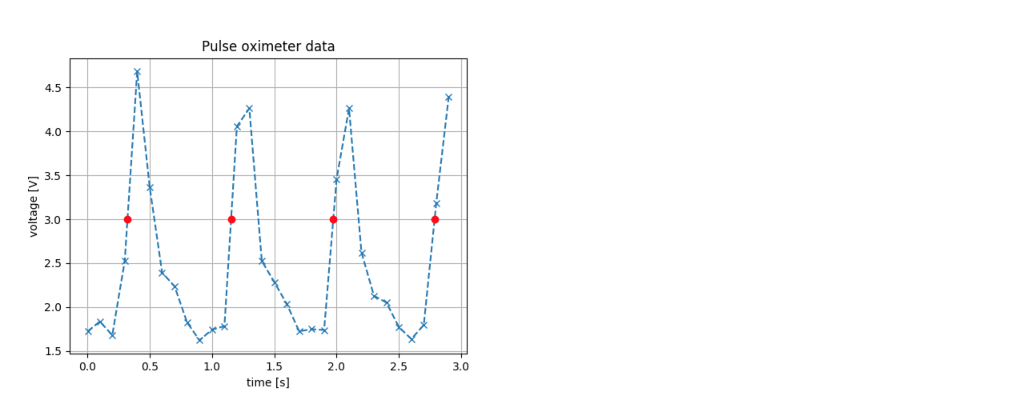
Part C: Counting heart beat In the lecture, we counted the number of heart beats by counting the number of peaks whose value exceeds a threshold. In this exercise, you will use a different method to count the number of heart beats. We will describe the method shortly. Before reading on, you should download these three files: lab05c_prelim.py, time data complete.txt and voltage data complete.txt. We suggest that you open lab05c_prelim.py in the Spyder editor so that you can follow the description below. The first step of data analysis is very often to plot the data. The first part of the Python file lab05c_prelim.py loads the data and stores the data in two lists. The sampling time instants and voltage values are stored in, respectively, the variables time_list and voltage_list. The entries of these two lists are floats If you run lab05c_prelim, it plots voltage (y-axis) versus time (x-axis). You can see the oscillatory pattern of the voltage. After plotting the graph, you can see that the number of heart beats is fairly large. You can manually count them (if you really want to) but it is easy to make a mistake. What you really want to is to get the computer to count them for you For counting. you will be using a threshold voltage of 3V. In this exercise, you will use the following criterion for counting: Number of heart beats number of times the voltage crosses the 3V threshold and is increasing For example, the following plot shows the voltage from 0s to 3s. The crosses show the actual data points and we have linked the data points using dashed line. The solid red circlesin the plot indicate the time instants that the voltage crosses the 3V threshold and is increasing. These are upwards crossings of a threshold
Step by Step Solution
There are 3 Steps involved in it

Get step-by-step solutions from verified subject matter experts