

Question: hi .. I really need help with this assignment (it's grade twelve advanced functions). It would be greatly appreciated if you could answer EVERY question,
hi .. I really need help with this assignment (it's grade twelve advanced functions). It would be greatly appreciated if you could answer EVERY question, and if you could include all the required information in your answers. I don't have to hand this in until tonight (22 hours from now), so you can take your time .. AND PLEASE GIVE ME THE CORRECT ANSWERS. I'll give a thumbs up and a good review - thanks! I appreciate it SO much :)
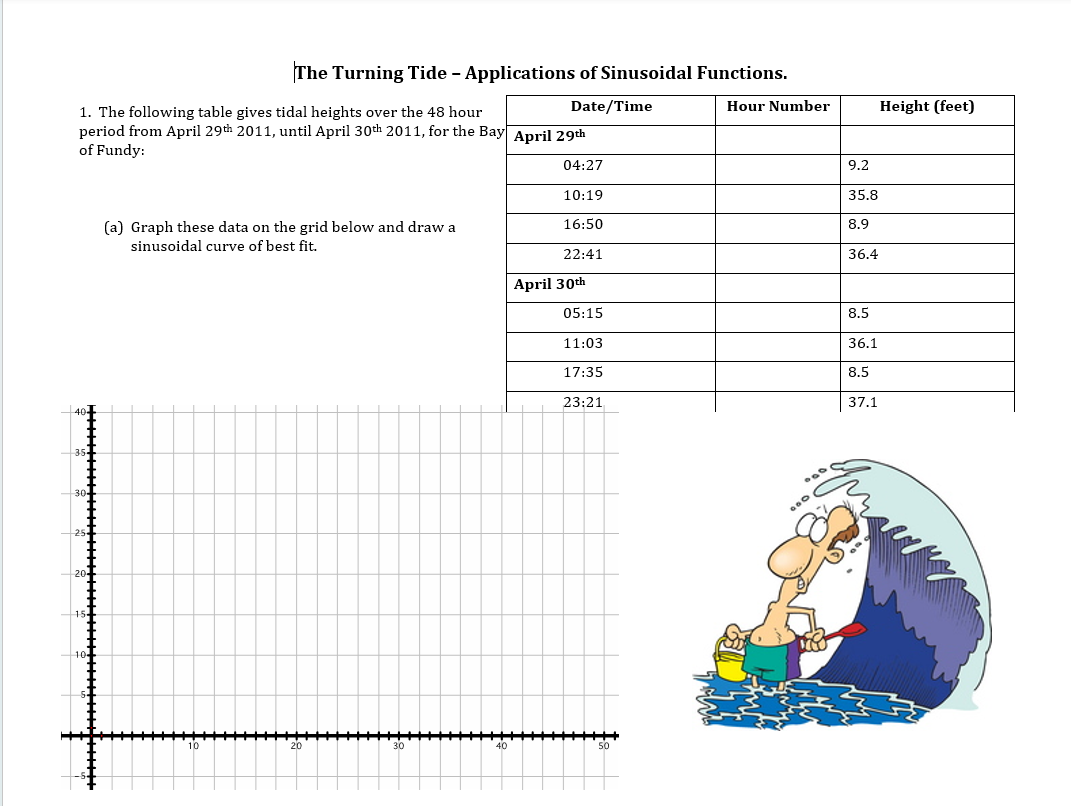
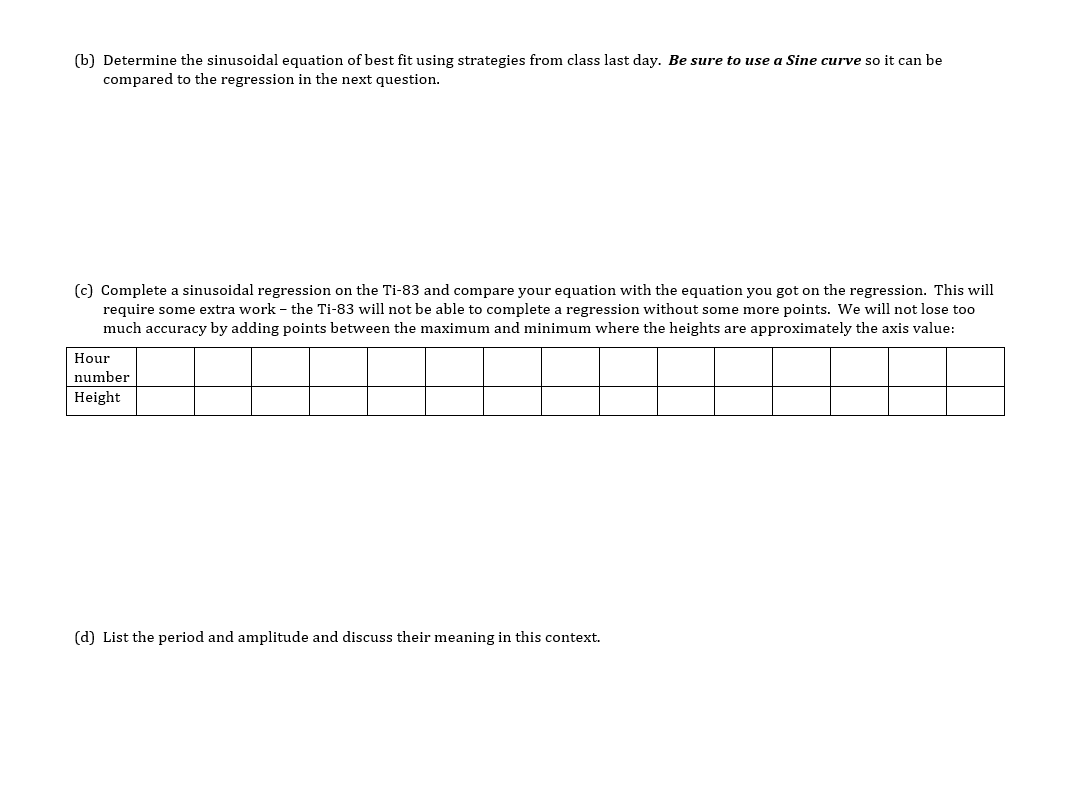
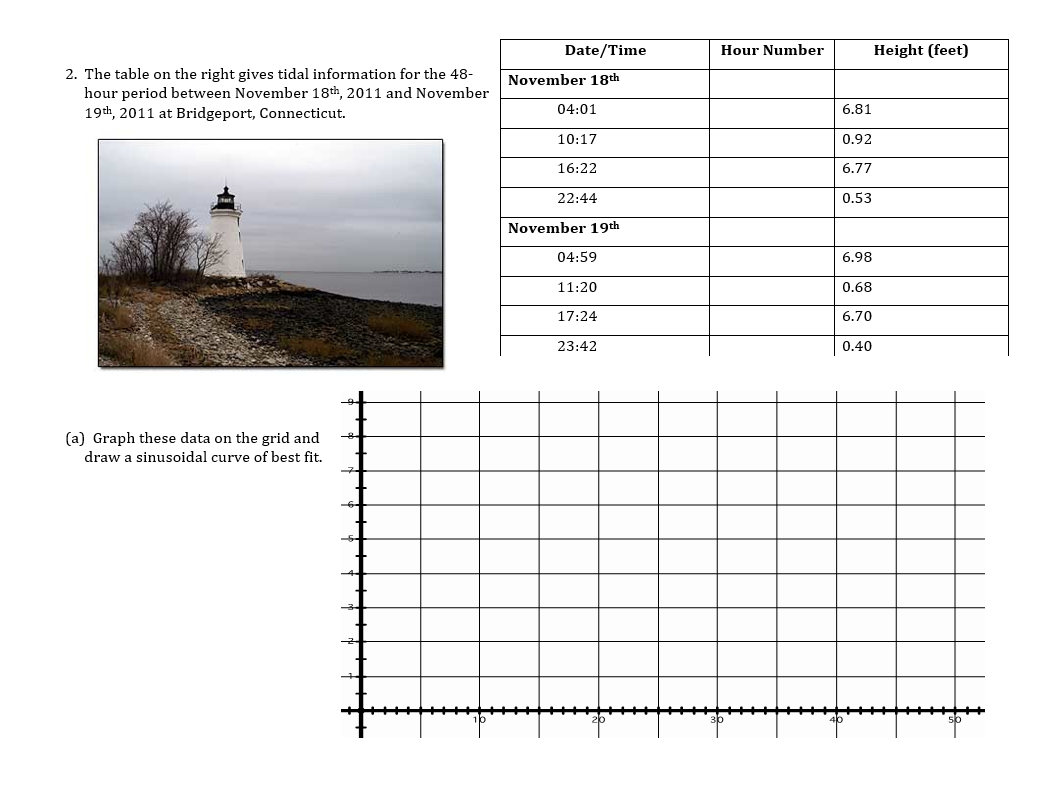
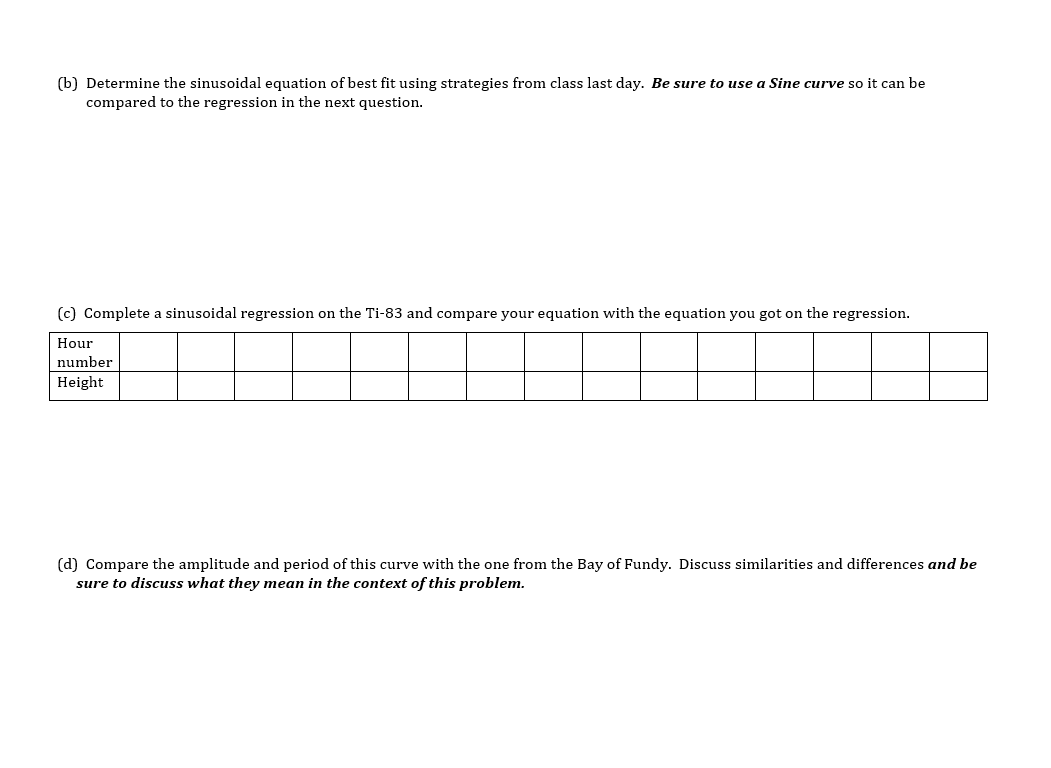
The Turning Tide - Applications of Sinusoidal Functions. 1. The following table gives tidal heights over the 48 hour Date/ Time Hour Number Height (feet) period from April 29th 2011, until April 30th 2011, for the Bay April 29th of Fundy: 04:27 9.2 10:19 35.8 (a) Graph these data on the grid below and draw a 16:50 8.9 sinusoidal curve of best fit. 22:41 36.4 April 30th 05:15 8.5 11:03 36.1 17:35 8.5 23:21 37.1 135 25 40 50[b] Determine the sinusoidal equation ofbest fit using strategies from class last day. Be sure to use a Sine curve so it can be compared to the regression in the next question. [c] Complete a sinusoida regression on the Ti-83 and compare your equation with :he equation you got on the regression. This will require some extra work the Ti83 will not be able to complete a regression without some more points. We will not lose too much accuracy by adding points between the maximum and minimum where the heights are approximately the axis value: Hour number Height [d] List the period and amplitude and discuss their meaning in this context. Date/Time Hour Number Height (feet) 2. The table on the right gives tidal information for the 48- November 18th hour period between November 18th, 2011 and November 19th, 2011 at Bridgeport, Connecticut. 04:01 6.81 10:17 0.92 16:22 6.77 22:44 0.53 November 19th 04:59 6.98 11:20 0.68 17:24 6.70 23:42 0.40 (a) Graph these data on the grid and draw a sinusoidal curve of best fit.(b) Determine the sinusoidal equation of best fit using strategies from class last day. Be sure to use a Sine curve so it can be compared to the regression in the next question. (c) Complete a sinusoidal regression on the Ti-83 and compare your equation with the equation you got on the regression. Hour number Height (d) Compare the amplitude and period of this curve with the one from the Bay of Fundy. Discuss similarities and differences and be sure to discuss what they mean in the context of this
Step by Step Solution
There are 3 Steps involved in it

Get step-by-step solutions from verified subject matter experts