

Question: Hi ! I really need help with this. This is only one question but with a bunch of information. Please I need help. This is
Hi ! I really need help with this. This is only one question but with a bunch of information. Please I need help. This is due tomorrow.
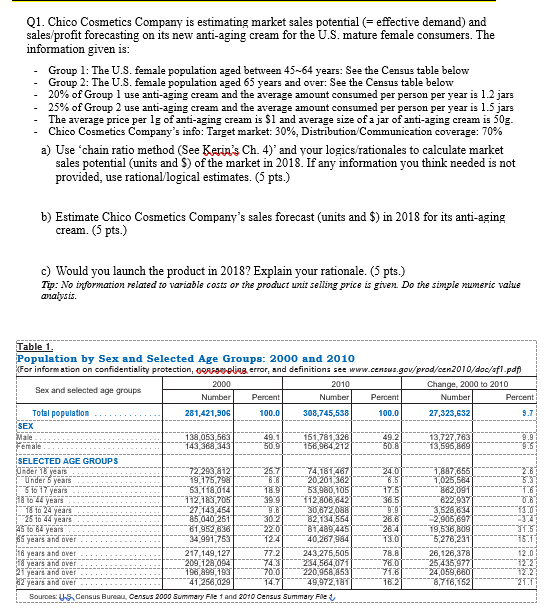
Q1. Chico Cosmetics Company is estimating market sales potential (= effective demand) and sales/profit forecasting on its new anti-aging cream for the U.S. mature female consumers. The information given is: Group 1: The U.S. female population aged between 45-64 years: See the Census table below Group 2: The U.S. female population aged 65 years and over: See the Census table below 20% of Group 1 use anti-aging cream and the average amount consumed per person per year is 1.2 jars 25% of Group 2 use anti-aging cream and the average amount consumed per person per year is 1.5 jars The average price per lg of anti-aging cream is $1 and average size of a jar of anti-aging cream is 50g. - Chico Cosmetics Company's info: Target market: 30%, Distrbution Communication coverage: 70% a) Use 'chain ratio method (See Kerin's Ch. 4)' and your logics/rationales to calculate market sales potential (units and S) of the market in 2018. If any information you think needed is not provided, use rational/logical estimates. (5 pts.) b) Estimate Chico Cosmetics Company's sales forecast (units and $) in 2018 for its anti-aging cream. (5 pts.) c) Would you launch the product in 2018? Explain your rationale. 6 pts.) Tip: No information related to variable costs or the product unit selling price is given. Do the simple numeric value analysis Table 1 Population by Sex and Selected Age Groups: 2000 and 2010 For information on confidentiality protection, 09 oling error, and definitions see www.census.gov/prod/cen2010/doc/sfi.pdf 2000 2010 Change, 2000 to 2010 Sex and selected age groups Number Percent Number Percent Number Percent Total population 281,421,906 100.0 308,745,538 100.0 27,323,632 9.7 SEX Male 138,053,563 49.1 151,781,326 49.2 13,727,763 Female 143,368,343 30.91 156,964 212 508 13,596,689 9.5 SELECTED AGE GROUPS Under 18 years 72 293,812 25.7 74,181,467 24.0 1,887,6581 Under 5 years 79,175.795 20,201,362 1,025,5841 5.37 15 16 17 years 53. 118,014 18.9 33,980,105 17.5 882,0911 1.6 18 16 4 years 112.183.705 112.806 642 36.5 622,937 12 16 24 years 27.143,454 30,872036 3,528,634 13.01 2516 44 years 85040 251 30.2 82,134,554 26.6 2,906 697 23:21 25 % 82 years 61.952,836 220 87,489,425 264 19,5:36,800 11.5 5 years and over 34.991.753 124 240 267,964 13.0 5,278,231 15.11 18 years and over 217.149.127 77.2 243 275,505 78.8 26,126,378 12.01 years and over 209,128,692 74.3 234,564,071 76.0 25,435,977 12:21 21 years and over 198,899,123 70.0 220,9687853 71.6 24,059,6801 12.2 2 years and over 41.256,029 14.7 49,972.181 16.2 8,716,752 21.11 Sources: US Census Bureau. Census 2000 Summary File 1 and 2010 Census Summary File Q1. Chico Cosmetics Company is estimating market sales potential (= effective demand) and sales/profit forecasting on its new anti-aging cream for the U.S. mature female consumers. The information given is: Group 1: The U.S. female population aged between 45-64 years: See the Census table below Group 2: The U.S. female population aged 65 years and over: See the Census table below 20% of Group 1 use anti-aging cream and the average amount consumed per person per year is 1.2 jars 25% of Group 2 use anti-aging cream and the average amount consumed per person per year is 1.5 jars The average price per lg of anti-aging cream is $1 and average size of a jar of anti-aging cream is 50g. - Chico Cosmetics Company's info: Target market: 30%, Distrbution Communication coverage: 70% a) Use 'chain ratio method (See Kerin's Ch. 4)' and your logics/rationales to calculate market sales potential (units and S) of the market in 2018. If any information you think needed is not provided, use rational/logical estimates. (5 pts.) b) Estimate Chico Cosmetics Company's sales forecast (units and $) in 2018 for its anti-aging cream. (5 pts.) c) Would you launch the product in 2018? Explain your rationale. 6 pts.) Tip: No information related to variable costs or the product unit selling price is given. Do the simple numeric value analysis Table 1 Population by Sex and Selected Age Groups: 2000 and 2010 For information on confidentiality protection, 09 oling error, and definitions see www.census.gov/prod/cen2010/doc/sfi.pdf 2000 2010 Change, 2000 to 2010 Sex and selected age groups Number Percent Number Percent Number Percent Total population 281,421,906 100.0 308,745,538 100.0 27,323,632 9.7 SEX Male 138,053,563 49.1 151,781,326 49.2 13,727,763 Female 143,368,343 30.91 156,964 212 508 13,596,689 9.5 SELECTED AGE GROUPS Under 18 years 72 293,812 25.7 74,181,467 24.0 1,887,6581 Under 5 years 79,175.795 20,201,362 1,025,5841 5.37 15 16 17 years 53. 118,014 18.9 33,980,105 17.5 882,0911 1.6 18 16 4 years 112.183.705 112.806 642 36.5 622,937 12 16 24 years 27.143,454 30,872036 3,528,634 13.01 2516 44 years 85040 251 30.2 82,134,554 26.6 2,906 697 23:21 25 % 82 years 61.952,836 220 87,489,425 264 19,5:36,800 11.5 5 years and over 34.991.753 124 240 267,964 13.0 5,278,231 15.11 18 years and over 217.149.127 77.2 243 275,505 78.8 26,126,378 12.01 years and over 209,128,692 74.3 234,564,071 76.0 25,435,977 12:21 21 years and over 198,899,123 70.0 220,9687853 71.6 24,059,6801 12.2 2 years and over 41.256,029 14.7 49,972.181 16.2 8,716,752 21.11 Sources: US Census Bureau. Census 2000 Summary File 1 and 2010 Census Summary File
Step by Step Solution
There are 3 Steps involved in it

Get step-by-step solutions from verified subject matter experts