

Question: Hi, im not sure how to do this question, please help me figure it out, i will upvote you! Question 12 (answer all parts). As
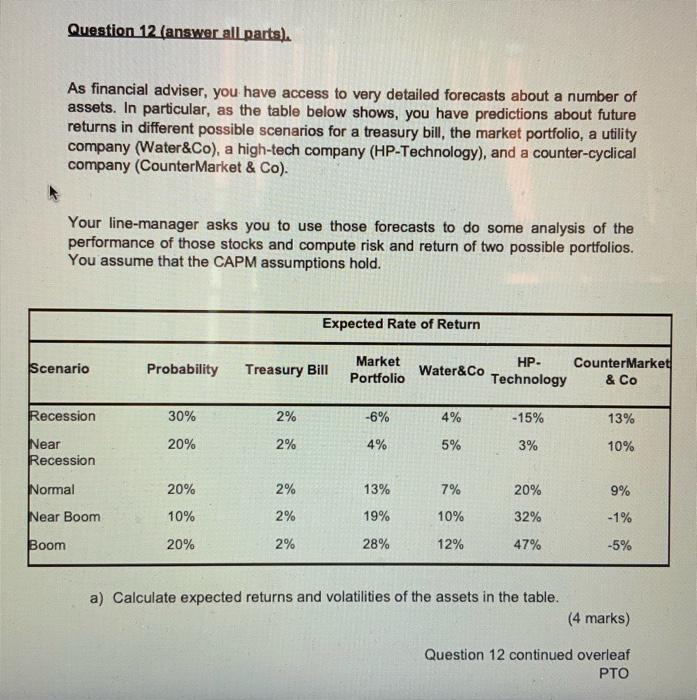

Question 12 (answer all parts). As financial adviser, you have access to very detailed forecasts about a number of assets. In particular, as the table below shows, you have predictions about future returns in different possible scenarios for a treasury bill, the market portfolio, a utility company (Water&Co), a high-tech company (HP-Technology), and a counter-cyclical company (CounterMarket & Co). Your line-manager asks you to use those forecasts to do some analysis of the performance of those stocks and compute risk and return of two possible portfolios. You assume that the CAPM assumptions hold. Expected Rate of Return Market Scenario Probability Treasury Bill Water&Co HP- Technology CounterMarket & Co Portfolio Recession 30% 2% -6% 4% -15% 13% Near 20% 2% 4% 5% 3% 10% Recession Normal 20% 2% 13% 7% 20% 9% Near Boom 10% 2% 19% 10% 32% -1% Boom 20% 2% 28% 12% 47% -5% a) Calculate expected returns and volatilities of the assets in the table. (4 marks) Question 12 continued overleaf PTO Question 12 (answer all parts). As financial adviser, you have access to very detailed forecasts about a number of assets. In particular, as the table below shows, you have predictions about future returns in different possible scenarios for a treasury bill, the market portfolio, a utility company (Water&Co), a high-tech company (HP-Technology), and a counter-cyclical company (CounterMarket & Co). Your line-manager asks you to use those forecasts to do some analysis of the performance of those stocks and compute risk and return of two possible portfolios. You assume that the CAPM assumptions hold. Expected Rate of Return Market Scenario Probability Treasury Bill Water&Co HP- Technology CounterMarket & Co Portfolio Recession 30% 2% -6% 4% -15% 13% Near 20% 2% 4% 5% 3% 10% Recession Normal 20% 2% 13% 7% 20% 9% Near Boom 10% 2% 19% 10% 32% -1% Boom 20% 2% 28% 12% 47% -5% a) Calculate expected returns and volatilities of the assets in the table. (4 marks) Question 12 continued overleaf PTO
Step by Step Solution
There are 3 Steps involved in it

Get step-by-step solutions from verified subject matter experts