

Question: Hi Im posting it second time. Please answer it. So I had to do a project inquired that which i did . But I need
 Project
 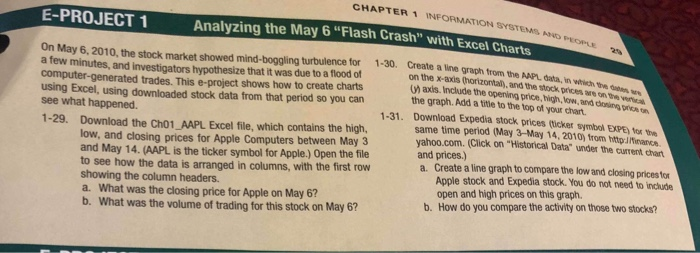 Questions
  Book
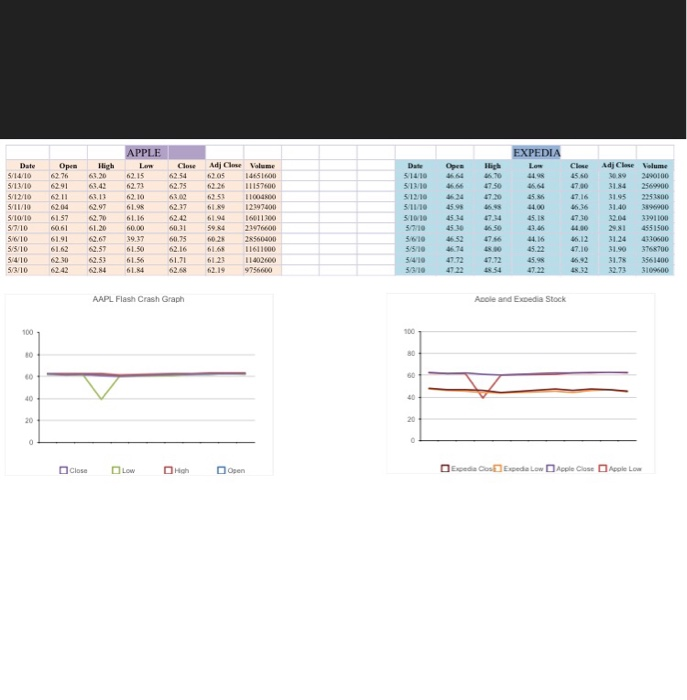
Book EXPEDIA Date Opem ih Lm Close Adj Clove Volume 6254 1451600 5/13/10 6291 63.42 62.73 62.75 6226 57600 Close Adj Clase Volume 45.50 39 240100 513/10 466647506 7 3184 2569900 51210 24 470 45.8647163195 2252800 5/1110 45.9846984400636 3140 3896900 73 3204 391100 44.00 29.81 455 1500 Date Ors h 51410664 5/14/1062766,20 621s 84.98 5/12/10 6211 6,13 6210 625 100480 5/11/10 6204 62.97 6198 62.37 6189 12397400 5/10/10 615762.70 61.16 62.42 6194 16011300 5/7/10 661.20 60.006031 598423976600 51010 453 473445.18 5/6/10 61.91 62.67 3937 60 602S 2S560100 5/5/10 6162 62.57 61.50 62.6 1.68 11611000 04652 7644.16 4674 612 3124 4330600 45.22 47.10 31.90 376000 5410 62.3062.53 6242 62.84 5410 47.72 47.2 498 61.56 61.71 6123 692 31783561400 628 6219 9756600 AAPL Flash Crash Graph Apole and Expedia Stock 100 100 t0 80 60 60 40 20 CHAPTER 1 INFORMATION SYSTEMS AND PEOPLE E-PROJECT 1 Analyzing the May 6 "Flash Crash" with Excel Charts On May 6, 2010, the stock market showed mind-boggling turbulence for 1-30. Create a line graph from the a few minutes, and investigators hypothesize that it was due to a flood of computer-generated trades. This e-project shows how to create charts using Excel, using downloaded stock data from that period so you can see what happened. on the x-axis (horizontal,and the stock prices are on the AAPL data, in n werich the dates Uh axls. Include the opening price, high, ow, and closing pric the graph. Add a title to thve top of your chart Download Expedia stock prices (ticker symbol EXPE) tor tve same time period (May 3-May 14, 2010) from hittp://Tinance. yahoo.com. (Click on "Historical Data" under the current chart 1-31. 1-29. Download the Ch01_AAPL Excel file, which contains the high, low, and closing prices for Apple Computers between May 3 and May 14. (AAPL is the ticker symbol for Apple.)Open the file to see how the data is arranged in columns, with the first row showing the column headers. a. What was the closing price for Apple on May 6? b. What was the volume of trading for this stock on May 6? and prices.) Create a line graph to compare the low and closing prices tor Apple stock and Expedia stock. You do not need to include open and high prices on this graph. How do you compare the activity on those two stocks? a. b. THIRD EDITION Introduction to Information Systems Patricia Wallace
Step by Step Solution
There are 3 Steps involved in it

Get step-by-step solutions from verified subject matter experts