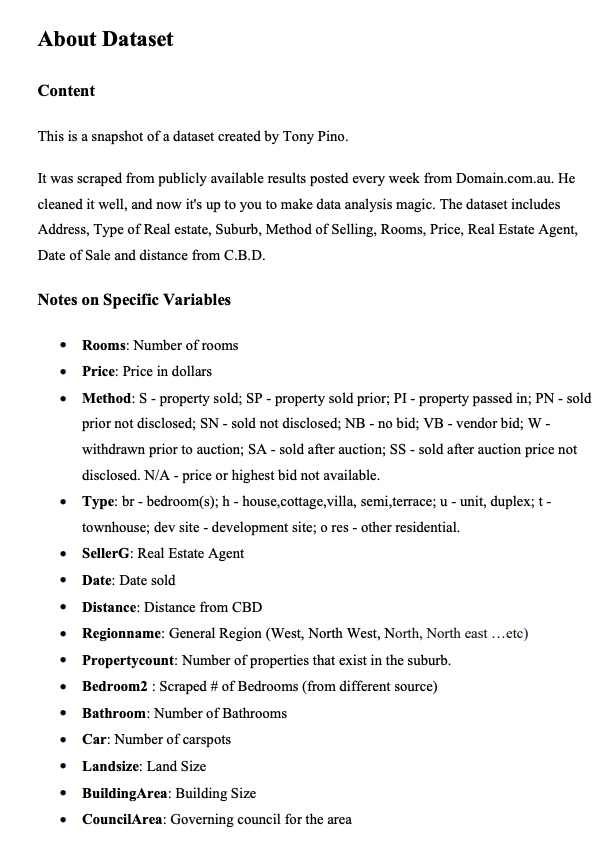
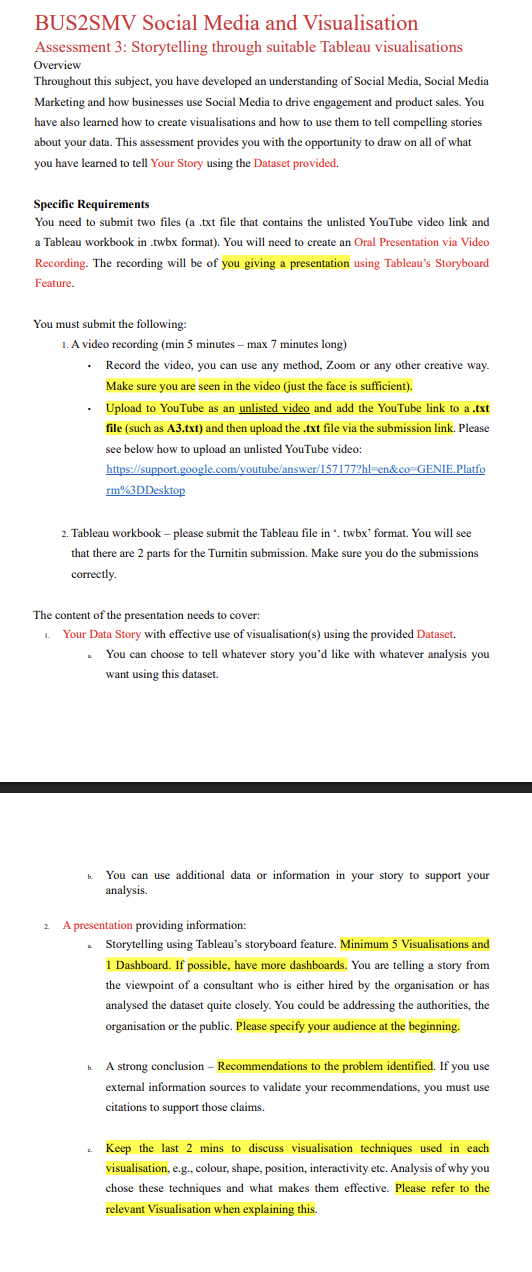
About Dataset Content This is a snapshot of a dataset created by Tony Pino. It was scraped from publicly available results posted every week from Domain.com.au. He cleaned it well, and now it's up to you to make data analysis magic. The dataset includes Address, Type of Real estate, Suburb, Method of Selling, Rooms, Price, Real Estate Agent, Date of Sale and distance from C.B.D. Notes on Specific Variables * Rooms: Number of rooms * Price: Price in dollars Method: 5 - property sold; SP - property sold prior; PI - property passed in; PN - sold prior not disclosed; SN - sold not disclosed; NB - no bid; VB - vendor bid; W - withdrawn prior to auction; SA - sold after auction; SS - sold after auction price not disclosed. N/A - price or highest bid not available. Type: br - bedroom(s); h - house,cottage,villa, semi,terrace; u - unit, duplex; t - townhouse; dev site - development site; o res - other residential. e SellerG: Real Estate Agent * Date: Date sold * Distance: Distance from CBD * Regionname: General Region (West, North West, North, North east ...etc) * Propertycount: Number of properties that exist in the suburb. * Bedroom? : Scraped # of Bedrooms (from different source) * Bathroom: Number of Bathrooms e Car: Number of carspots * Landsize: Land Size * BuildingArea: Building Size * CouncilArea: Governing council for the area BUS2SMV Social Media and Visualisation Assessment 3: Storytelling through suitable Tableau visualisations Overview Throughout this subject, you have developed an understanding of Social Media, Social Media Marketing and how businesses use Social Media to drive engagement and product sales. You have also learned how to create visualisations and how to use them to tell compelling stories about your data. This assessment provides you with the opportunity to draw on all of what you have learned to tell Your Story using the Dataset provided. Specific Requirements You need to submit two files (a .txt file that contains the unlisted YouTube video link and a Tableau workbook in .twbx format). You will need to create an Oral Presentation via Video Recording. The recording will be of you giving a presentation using Tableau''s Storyboard Feature. You must submit the following: 1. A video recording (min 5 minutes max 7 minutes long) - Record the video, you can use any method, Zoom or any other creative way. Make sure you are seen in the video (just the face is sufficient). + Upload to YouTube as an unlisted video and add the YouTube link to a .txt file (such as A3.txt) and then upload the .txt file via the submission link. Please see below how to upload an unlisted YouTube video: hittps://support.coogle.cony'youtube/answer!157177?hl=en&co=GENIE.Platio rm?s3DDesktop 2. Tableau workbook please submit the Tableau file in *. wbx' format. You will see that there are 2 parts for the Turnitin submission. Make sure you do the submissions correctly. The content of the presentation needs to cover: 1. Your Data Story with effective use of visualisation(s) using the provided Dataset. You can choose to tell whatever story you'd like with whatever analysis you want using this dataset. You can use additional data or information in your story to support your analysis. 2 Apresentation providing information: Storytelling using Tableau's storyboard feature. Minimum 5 Visualisations and 1 Dashboard. If possible, have more dashboards. You are telling a story from the viewpoint of a consultant who is either hired by the organisation or has analysed the dataset quite closely. You could be addressing the authorities, the organisation or the public. Please specify your audience at the beginning. Astrong conclusion Recommendations to the problem identified. If you use extemal information sources to validate your recommendations, you must use citations to support those claims. Keep the last 2 mins to diseuss visualisation techniques used in each visualisation, e.g., colour, shape, position, interactivity etc. Analysis of why you chose these techniques and what makes them effective. Please refer to the relevant Visualisation when explaining this
Step by Step Solution
There are 3 Steps involved in it
1 Expert Approved Answer
Step: 1 Unlock
Question Has Been Solved by an Expert!
Get step-by-step solutions from verified subject matter experts
Step: 2 Unlock
Step: 3 Unlock
Students Have Also Explored These Related Accounting Questions!