

Question: Hi please help me solve this as I will have similar questions on my upcoming exam, solve using all steps as if you were teaching,
Hi please help me solve this as I will have similar questions on my upcoming exam, solve using all steps as if you were teaching, so I can fully understand also PLEASE don't use cursive while solving
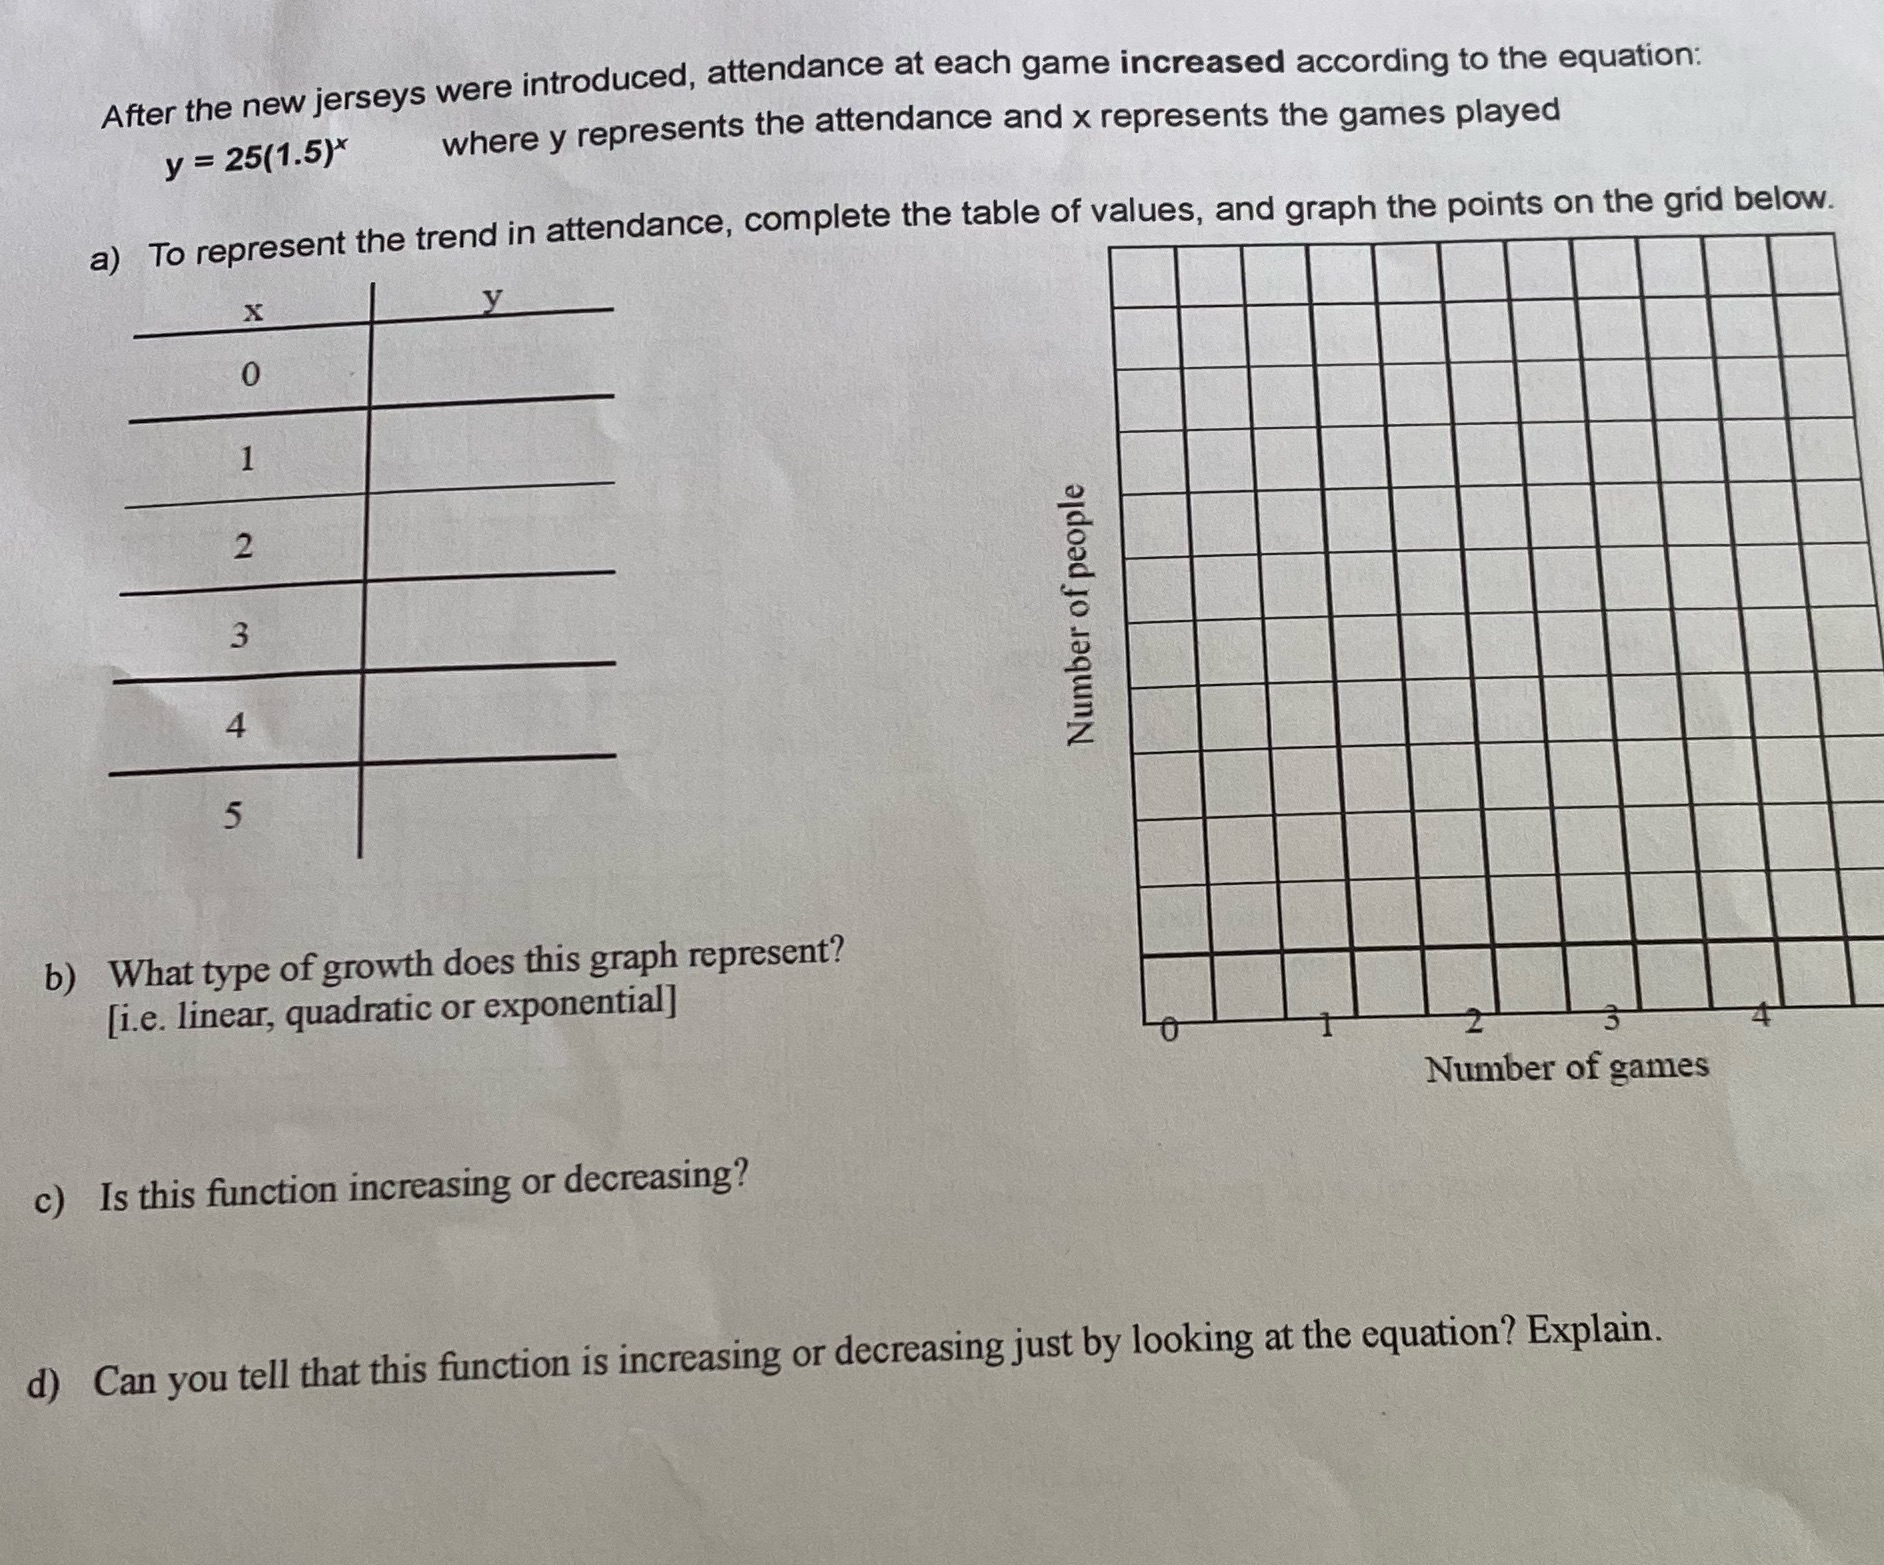
After the new jerseys were introduced, attendance at each game increased according to the equation: y = 25(1.5)* where y represents the attendance and x represents the games played a) To represent the trend in attendance, complete the table of values, and graph the points on the grid below. X 0 2 3 Number of people 4 b) What type of growth does this graph represent? [i.e. linear, quadratic or exponential] Number of games c) Is this function increasing or decreasing? d) Can you tell that this function is increasing or decreasing just by looking at the equation? Explain
Step by Step Solution
There are 3 Steps involved in it

Get step-by-step solutions from verified subject matter experts