

Question: hi please help me with my lab report. Use Miscrosoft Excel Spreadsheet for the Last two photos. So we can fill in the blacks in,
hi please help me with my lab report. Use Miscrosoft Excel Spreadsheet for the Last two photos. So we can fill in the blacks in, thank you.
For the last photo below, use a Microsoft Excel Spreadsheet. Please help me finish my lab report ASAP thank you


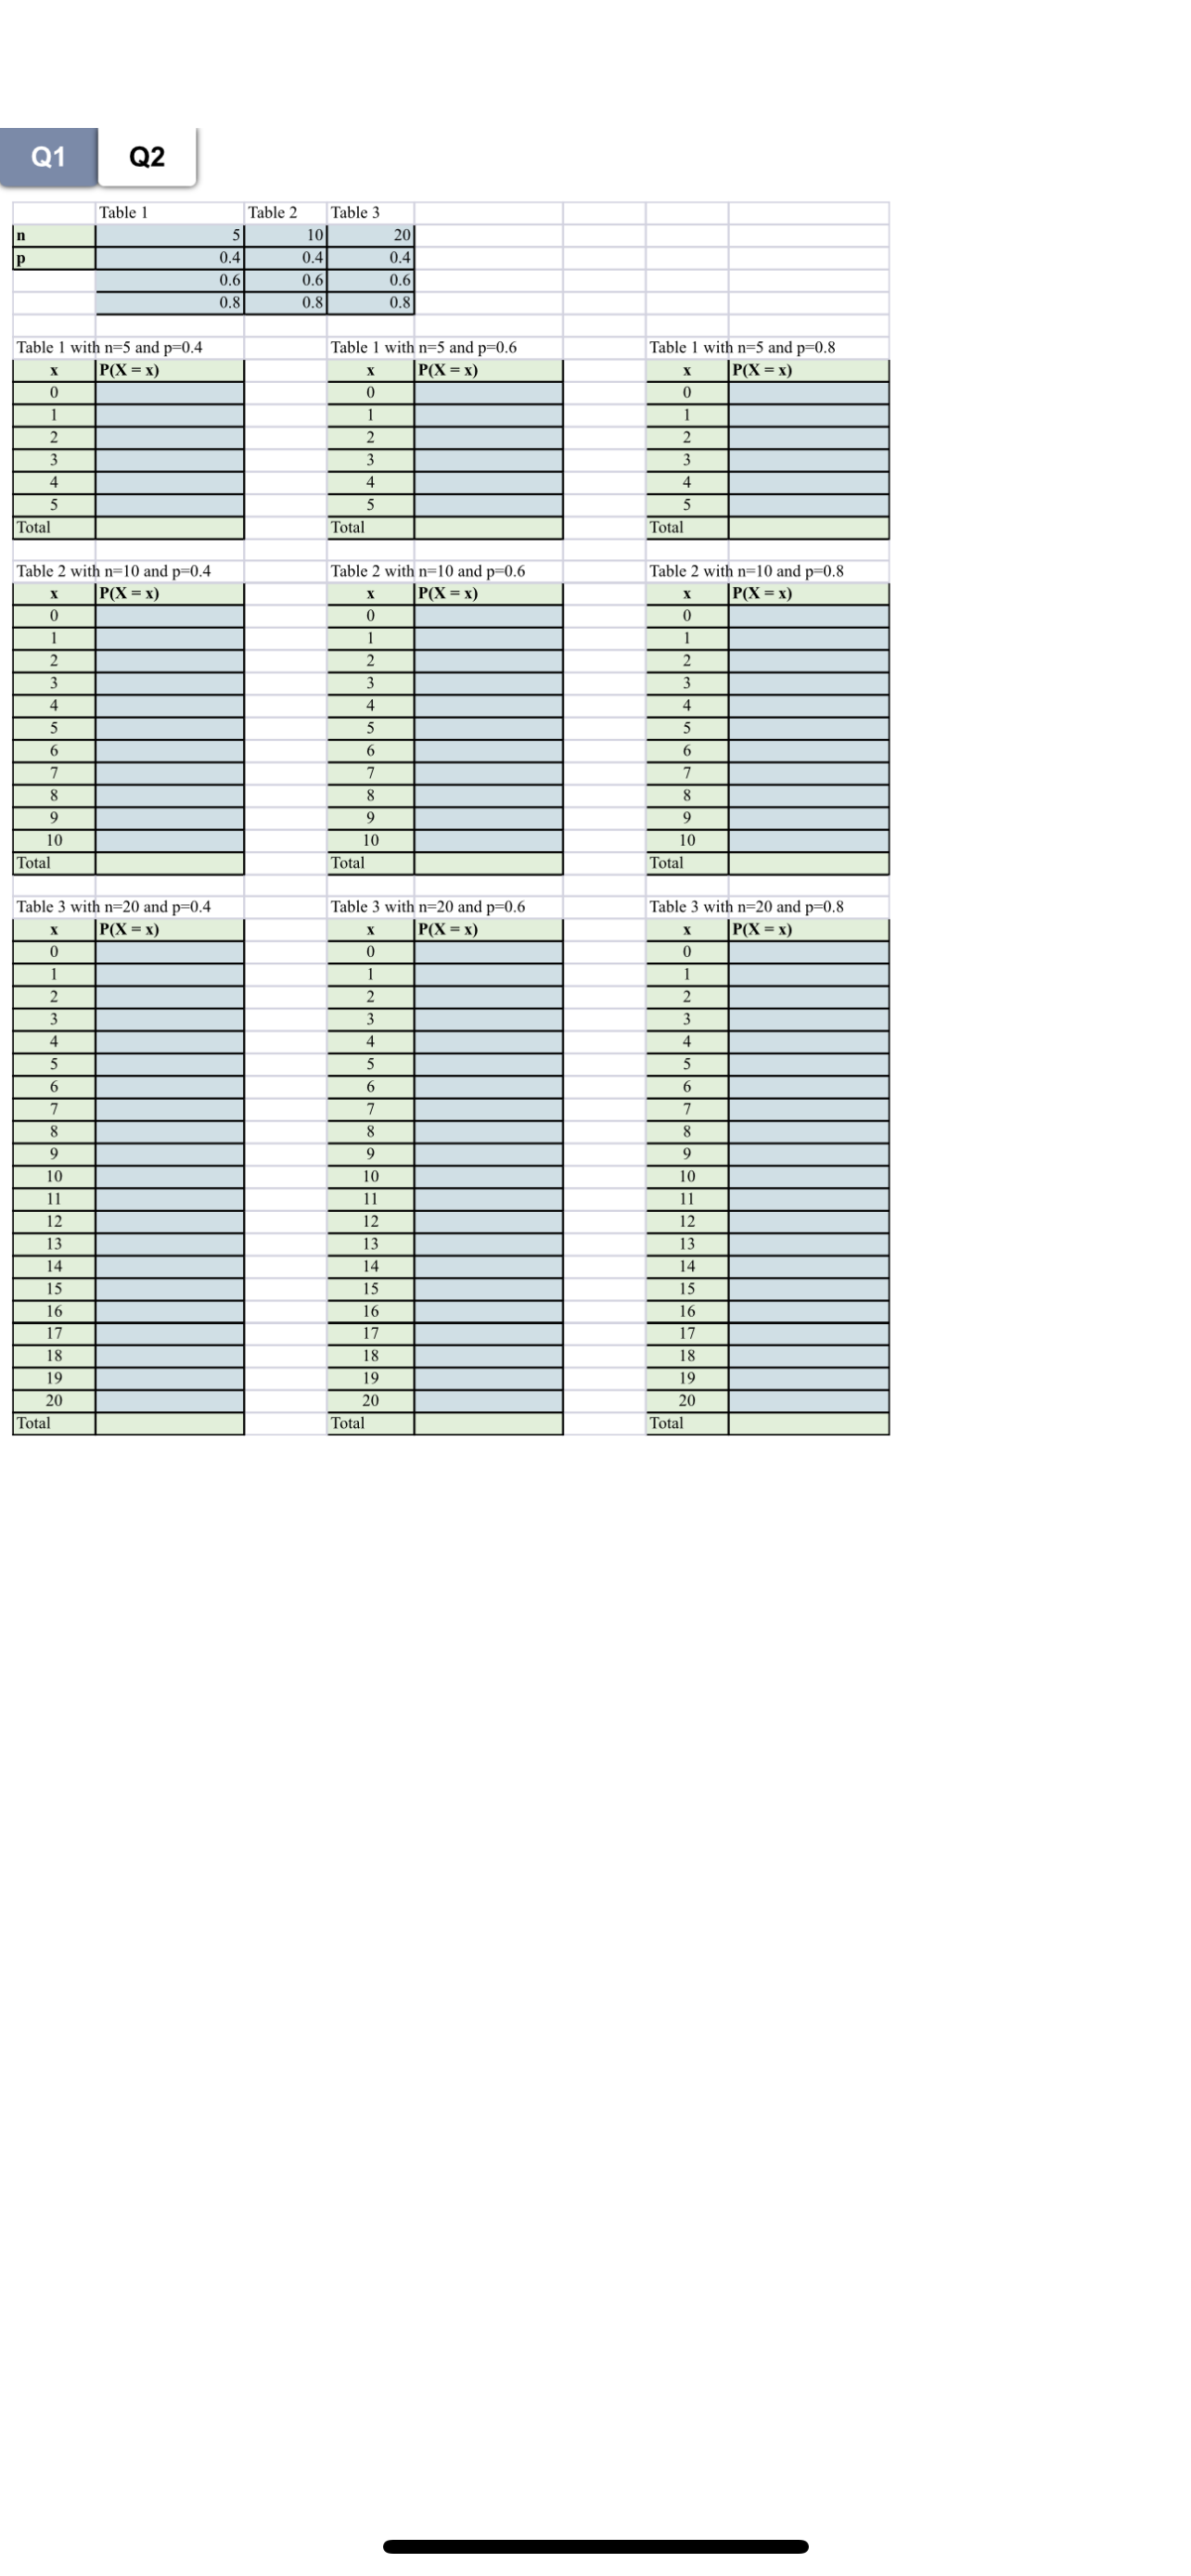
Course: Introduction to Applied Statistics I -Lab NORTHWESTERN Semester: Winter 2024 POLYTECHNIC Instructor: Dr. Abdel Name: ID: Lab report Objective Use Excel's built-in functions to study the binomial distribution. Instructions 1- The data are in the "Lab 7" excel file. You have two sheets. 2- For question 1, complete the empty cells of the excel sheet as per the question below, then copy and paste the table in the lab report. 3- For question 2, you are asked to construct a bar graph for each table (to be copied and pasted in your lab report) and to draw conclusions. 4- You are required to submit the lab report and the excel file. Question 1: If X is binomial with n = 20 and p = .7, find: a) P(X = 18) b) P(X > 8) c) P(9 EX
Step by Step Solution
There are 3 Steps involved in it

Get step-by-step solutions from verified subject matter experts