

Question: Hi! Please help me with this. Show the full solution since the handouts given by my professor is incomplete :( I want to know the
Hi! Please help me with this. Show the full solution since the handouts given by my professor is incomplete :( I want to know the formulas and how to do the scatter plot. Please show manual solution not through excel but excel may be used for the scatter plot thank you :(
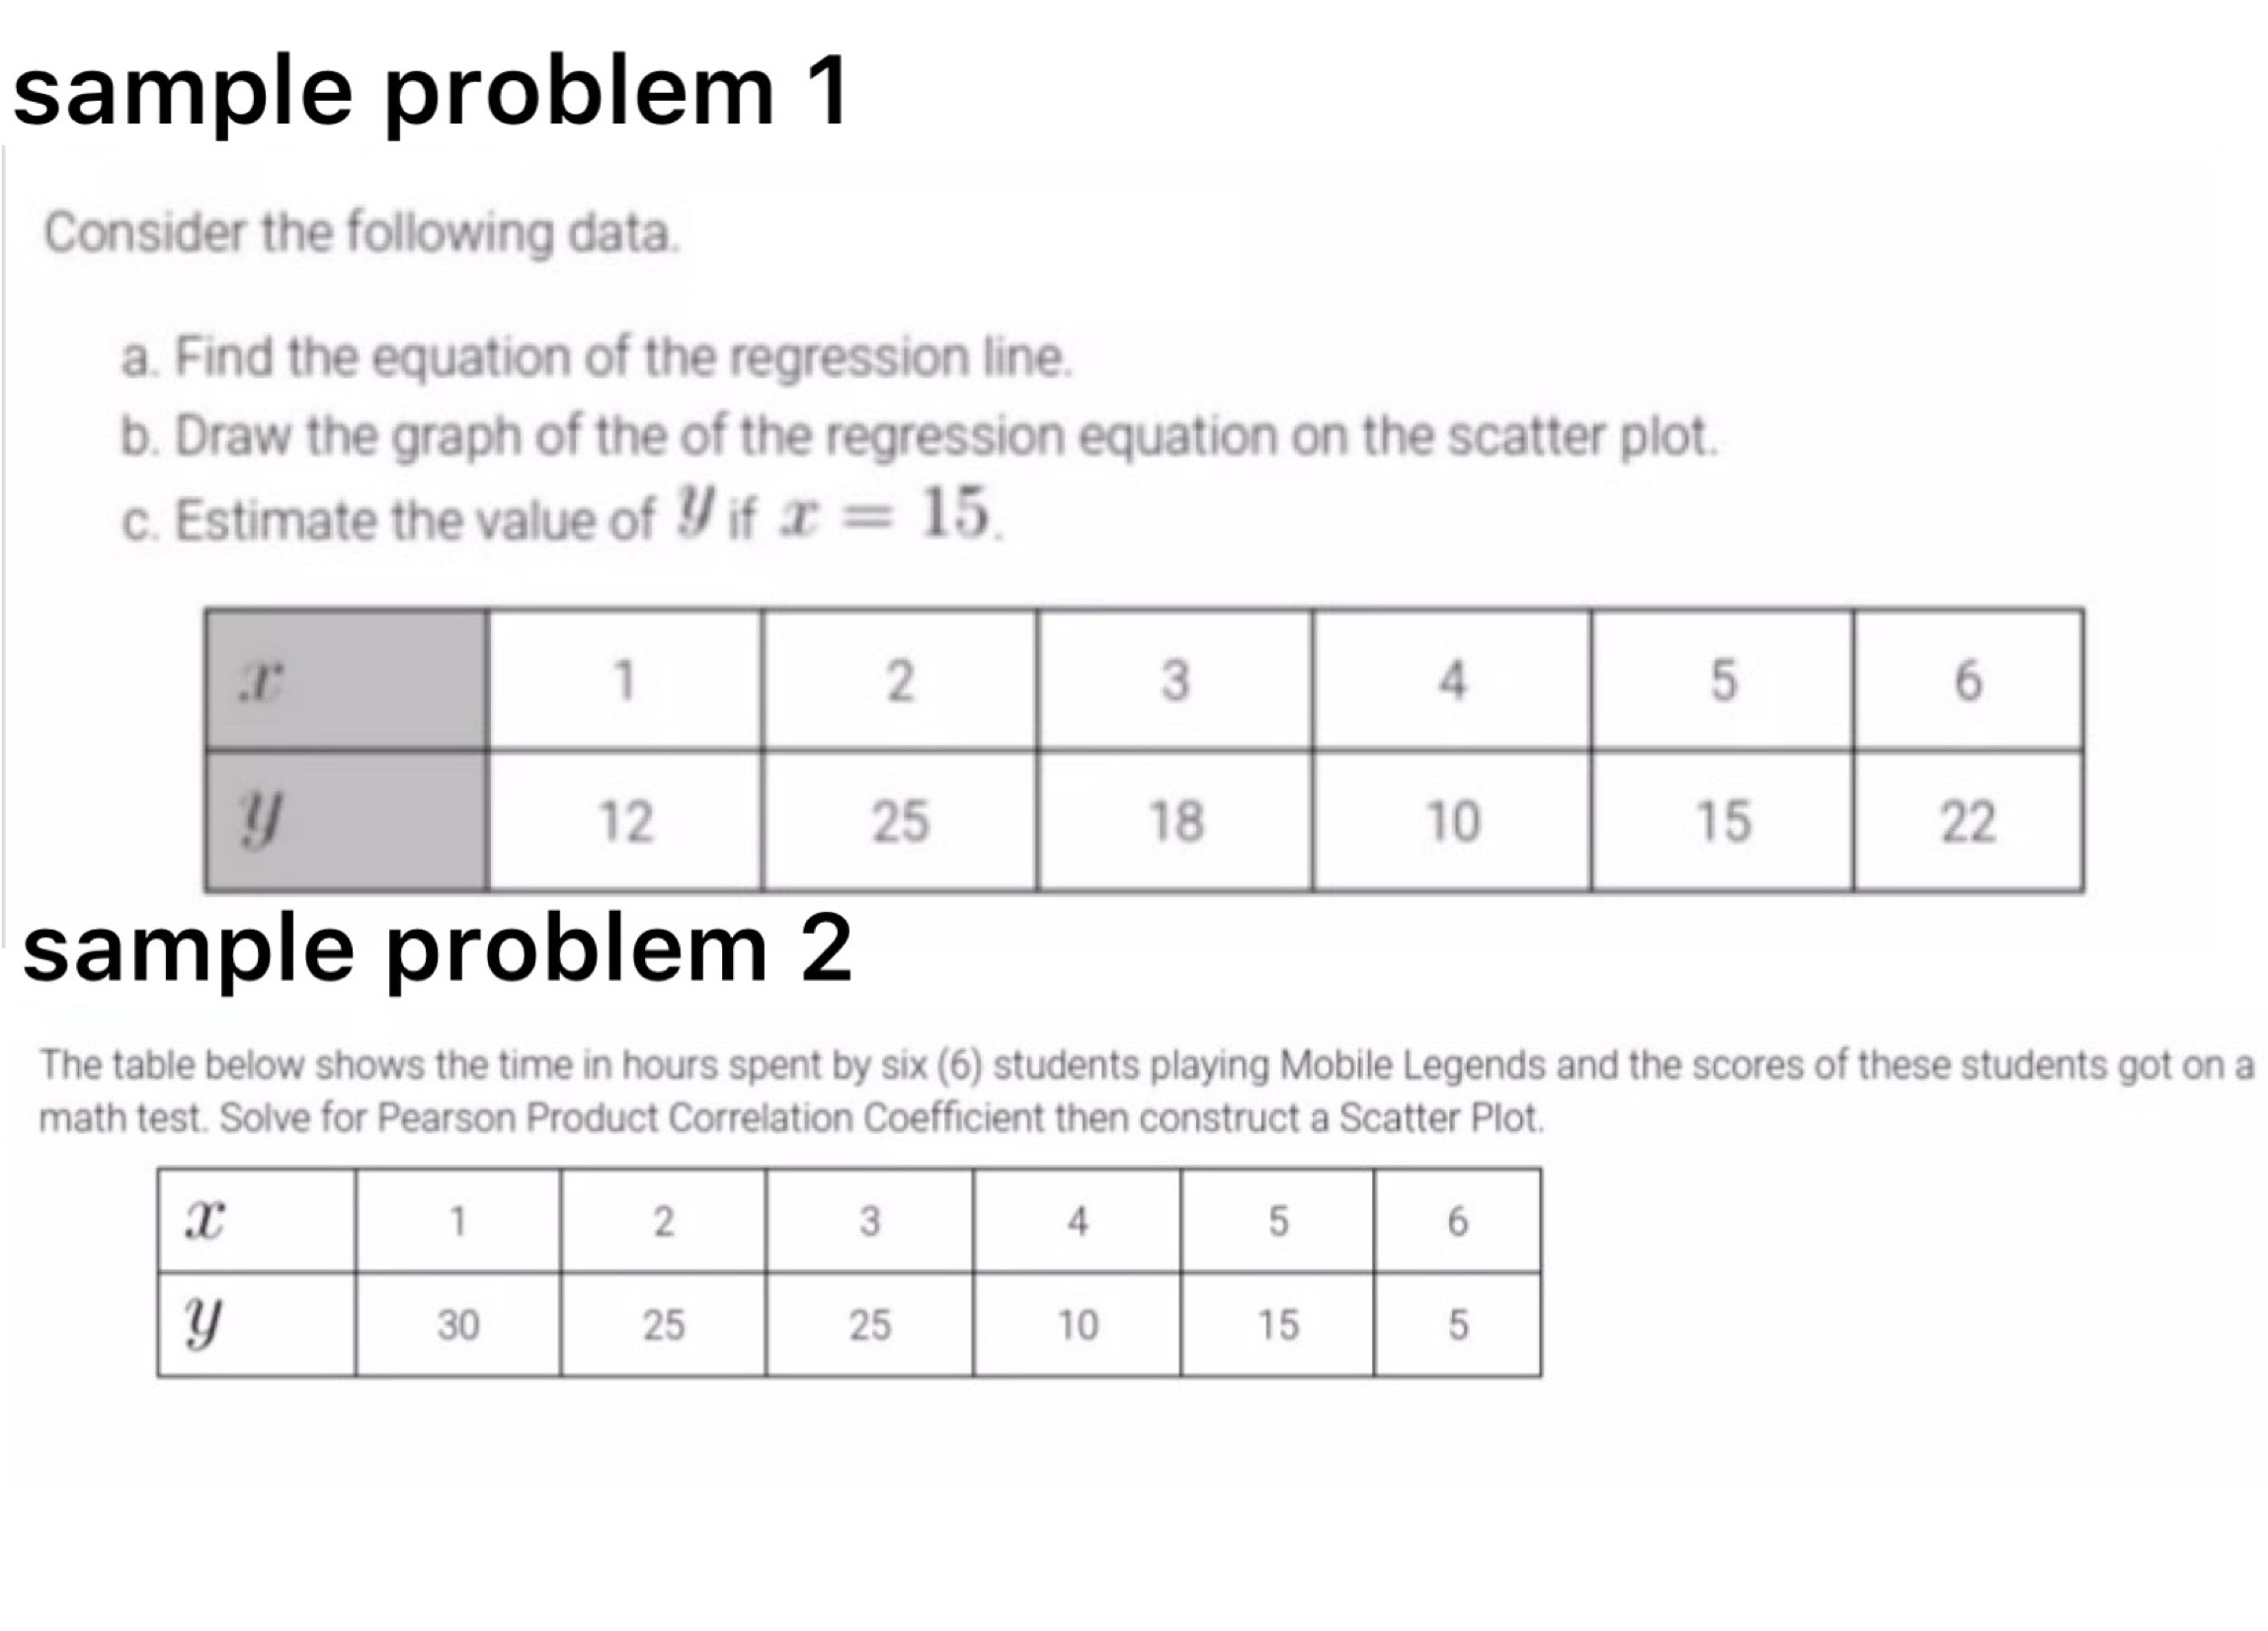
sample problem 1 Consider the following data. a. Find the equation of the regression line. b. Draw the graph of the of the regression equation on the scatter plot. C. Estimate the value of yif x = 15 2 3 4 5 6 12 25 18 10 15 22 sample problem 2 The table below shows the time in hours spent by six (6) students playing Mobile Legends and the scores of these students got on a math test. Solve for Pearson Product Correlation Coefficient then construct a Scatter Plot. 2 3 4 5 6 30 25 25 10 15 5
Step by Step Solution
There are 3 Steps involved in it

Get step-by-step solutions from verified subject matter experts