

Question: Hi, please help with my Octave/ Matlab plot combining two simple equations. Hi, I'm trying to plot a continuous-time Matlab equation y(t) consisting of x(t+1)
Hi, please help with my Octave/ Matlab plot combining two simple equations. 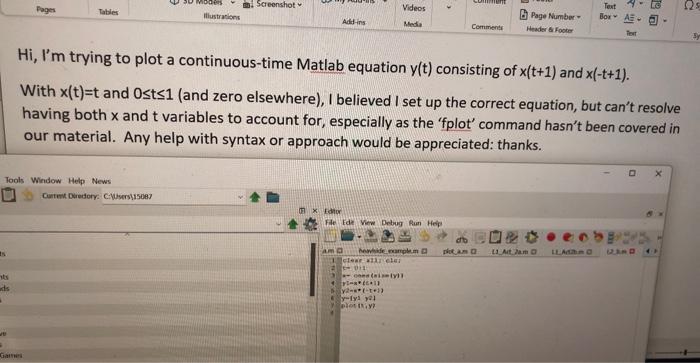
Hi, I'm trying to plot a continuous-time Matlab equation y(t) consisting of x(t+1) and x(t+1). With x(t)=t and 0t1 (and zero elsewhere), I believed I set up the correct equation, but can't resolve having both x and t variables to account for, especially as the ' f plot' command hasn't been covered in our material. Any help with syntax or approach would be appreciated: thanks
Step by Step Solution
There are 3 Steps involved in it
1 Expert Approved Answer
Step: 1 Unlock

Question Has Been Solved by an Expert!
Get step-by-step solutions from verified subject matter experts
Step: 2 Unlock
Step: 3 Unlock