

Question: Hi there - could you please help me understand how to graph this? I know we use the TC equation but I am unsure how

Hi there - could you please help me understand how to graph this? I know we use the TC equation but I am unsure how to solve it and how that translates to the graph - thank you so much!
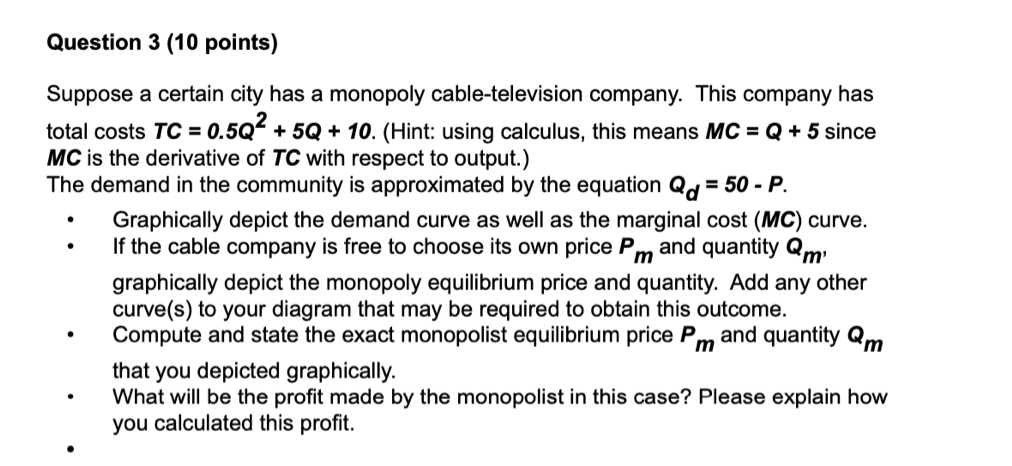
Question 3 (10 points) Suppose a certain city has a monopoly cable-television company. This company has total costs TC = 0.502 + 50 + 10. (Hint: using calculus, this means M0 = Q + 5 since MO is the derivative of T0 with respect to output.) The demand in the community is approximated by the equation 0d = 50 - P. Q Graphically depict the demand curve as well as the marginal cost (MC) curve. If the cable company is free to choose its own price Pm and quantity 0m, graphically depict the monopoly equilibrium price and quantity. Add any other curve(s) to your diagram that may be required to obtain this outcome. Compute and state the exact monopolist equilibrium price Pm and quantity am that you depicted graphically. What will be the prot made by the monopolist in this case? Please explain how you calculated this prot
Step by Step Solution
There are 3 Steps involved in it

Get step-by-step solutions from verified subject matter experts