

Question: hi there, i have uploaded the data to this question. However, I would like to double-check if the options I chose are correct, please help
hi there, i have uploaded the data to this question. However, I would like to double-check if the options I chose are correct, please help and thank you in advance.
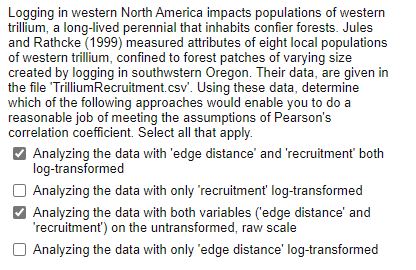
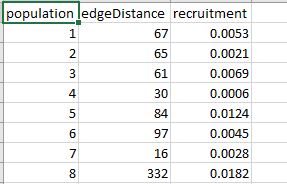
Logging in western North America impacts populations of western trillium, a long-lived perennial that inhabits confier forests. Jules and Rathcke (1999) measured attributes of eight local populations of western trillium, confined to forest patches of varying size created by logging in southwstern Oregon. Their data, are given in the file 'TrilliumRecruitment.csv'. Using these data, determine which of the following approaches would enable you to do a reasonable job of meeting the assumptions of Pearson's correlation coefficient. Select all that apply Analyzing the data with 'edge distance' and 'recruitment both log-transformed Analyzing the data with only 'recruitment' log-transformed Analyzing the data with both variables ('edge distance' and 'recruitment') on the untransformed, raw scale Analyzing the data with only 'edge distance' log-transformed\f
Step by Step Solution
There are 3 Steps involved in it

Get step-by-step solutions from verified subject matter experts