

Question: Hi there I need help on this question. Below is a bar graph from an American news outlet explaining people's differences of opinion on the
Hi there I need help on this question.
Below is a bar graph from an American news outlet explaining people's differences of opinion on the ultimate decision in a controversial court case. People have been sorted into political party ideology, indicating within each party how many agree with the court decision.
Can you help me figure out
A) IF THERES anything potentially misleading about the bar graph as shown? and then help me figure out what that means!
B) What change(s) could I make to this graph? and if I could use an alternative type of graph to represent the same information and which type
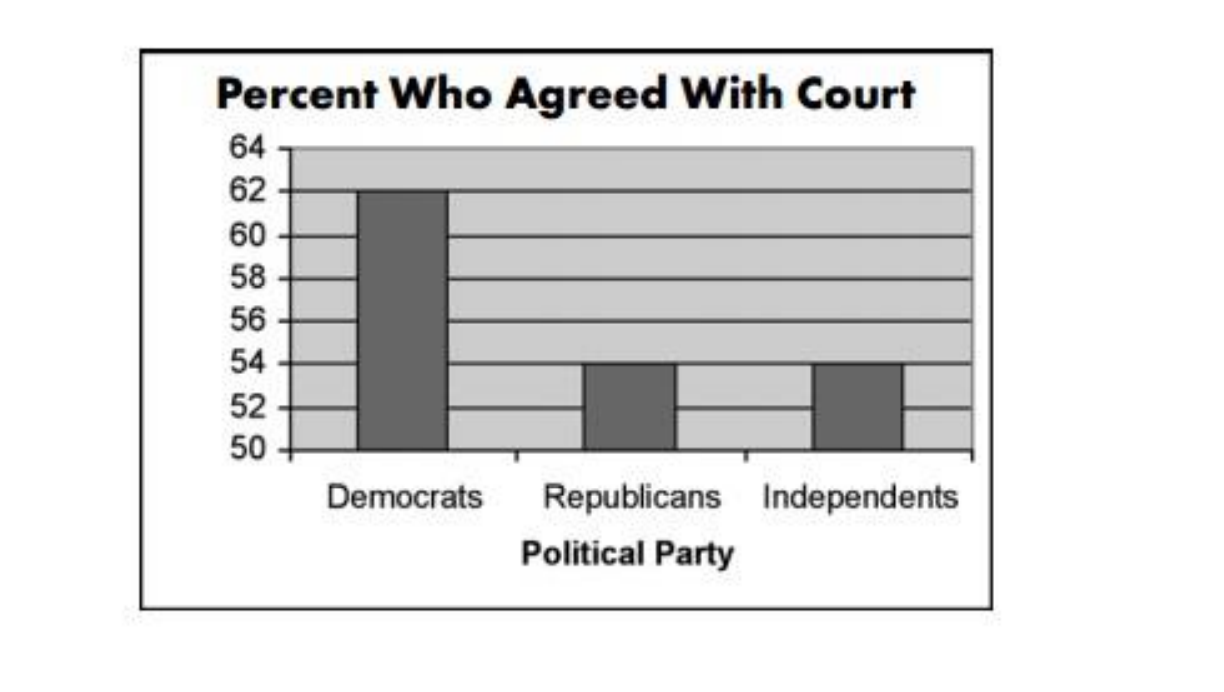
Percent Who Agreed With Court 64 62 60 58 56 54 52 50 Democrats Republicans Independents Political Party
Step by Step Solution
There are 3 Steps involved in it

Get step-by-step solutions from verified subject matter experts