

Question: Hi, Whats the answer to this question? The data table is below. Thank you. I've attempted some of the questions but I'm not sure if
Hi,
Whats the answer to this question? The data table is below. Thank you.
I've attempted some of the questions but I'm not sure if they're correct.
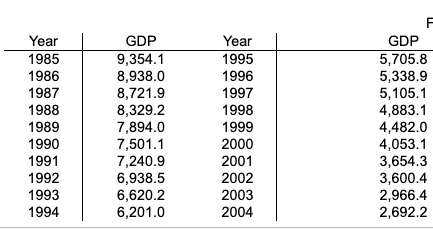
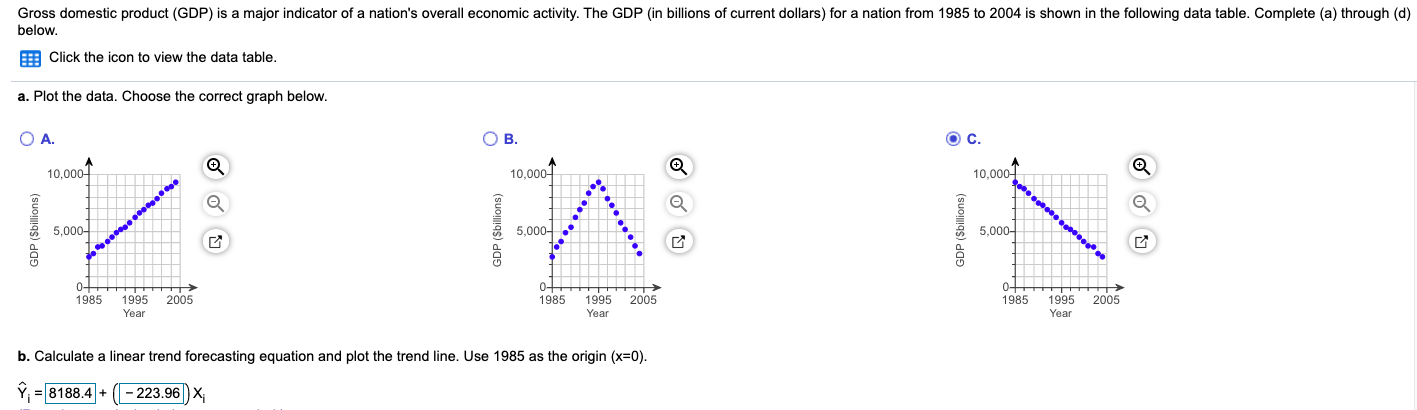
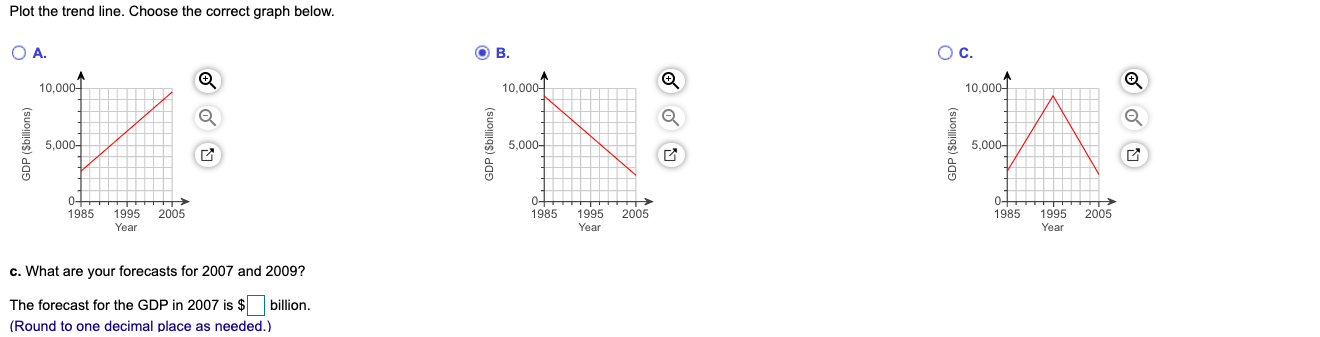

\fGross domestic product (GDP) is a major indicator of a nation's overall economic activity. The GDP (in billions of current dollars) for a nation from 1985 to 2004 is shown in the following data table. Complete (a) through (d) below. Click the icon to view the data table. a. Plot the data. Choose the correct graph below. O A. OB. O C. 10,000- 10,000- 10,000- GDP (Sbillions) GDP (Sbillions) ..... ... . 5,000- 5,000- GDP ($billions) 5,000- 1985 1995 2005 1985 1995 2005 1985 1995 2005 Year Yea Year b. Calculate a linear trend forecasting equation and plot the trend line. Use 1985 as the origin (x=0). Y = 8188.4 + -223.96 )X;Plot the trend line. Choose the correct graph below. O A. OB. O C. 10,000- 10,000- 10,000- GDP (Sbillions) 5,000- GDP (Sbillions) 5,000- GDP (Sbillions) 5,000- 1985 1995 2005 1985 1995 2005 1985 1995 2005 Year Year Year c. What are your forecasts for 2007 and 2009? The forecast for the GDP in 2007 is $ billion. Round to one decimal place as needed.)The forecast for the GDP in 2009 is $ billion. (Round to one decimal place as needed.) d. What conclusions can you reach concerning the trend in GDP? There is trend in GDP since 1985
Step by Step Solution
There are 3 Steps involved in it

Get step-by-step solutions from verified subject matter experts