

Question: his scatterplot shows the maintenance expense for a truck based on its years of service Maintenance Expense in dollars 600 500 400 300 200 Maintenance
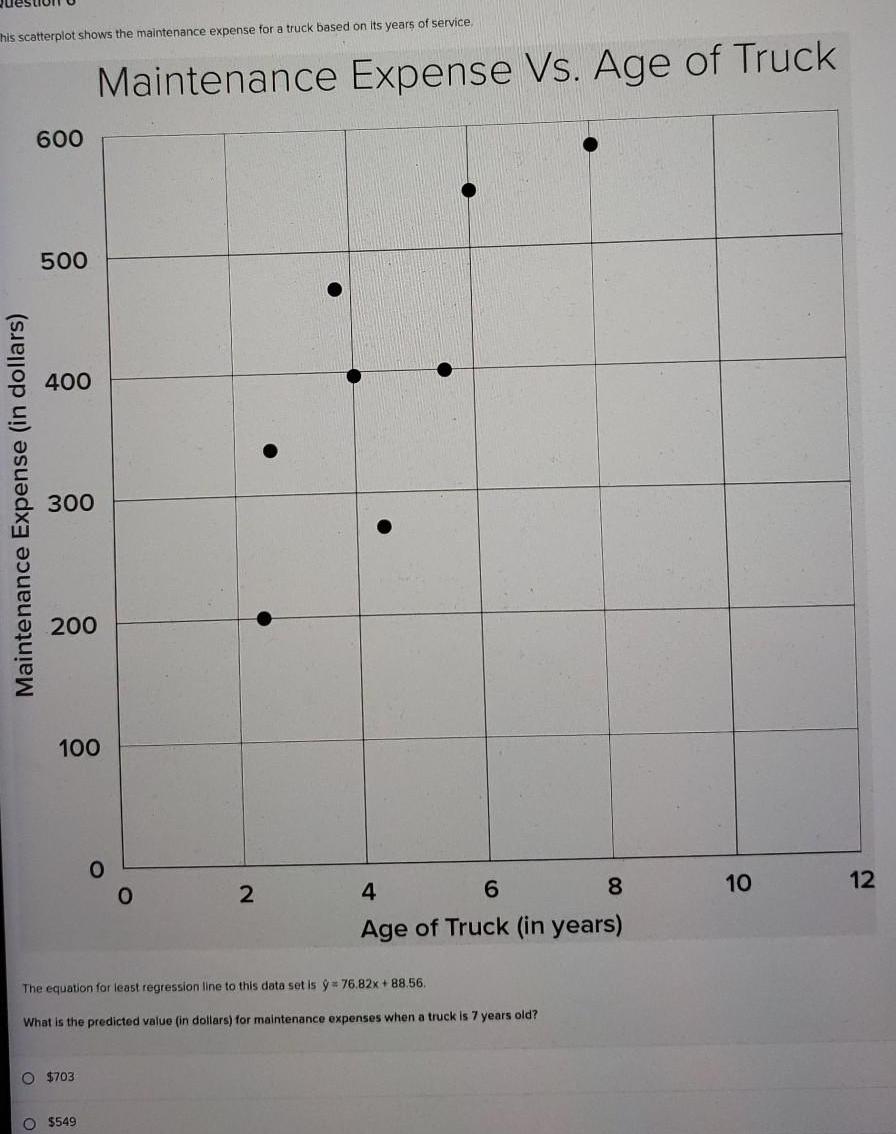

his scatterplot shows the maintenance expense for a truck based on its years of service Maintenance Expense in dollars 600 500 400 300 200 Maintenance Expense Vs Age of Truck 100 O 703 O 549 O 2 The equation for least regression line to this data set is 76 82x 88 56 What is the predicted value in dollars for maintenance expenses when a truck is 7 years old 4 6 8 Age of Truck in years 10 12
Step by Step Solution
There are 3 Steps involved in it
1 Expert Approved Answer
Step: 1 Unlock

Question Has Been Solved by an Expert!
Get step-by-step solutions from verified subject matter experts
Step: 2 Unlock
Step: 3 Unlock