

Question: Histogram b Histogram d 16- Q 12- Frequency Frequency 10 20 30 40 50 60 70 80 90 10 20 30 40 50 60 70
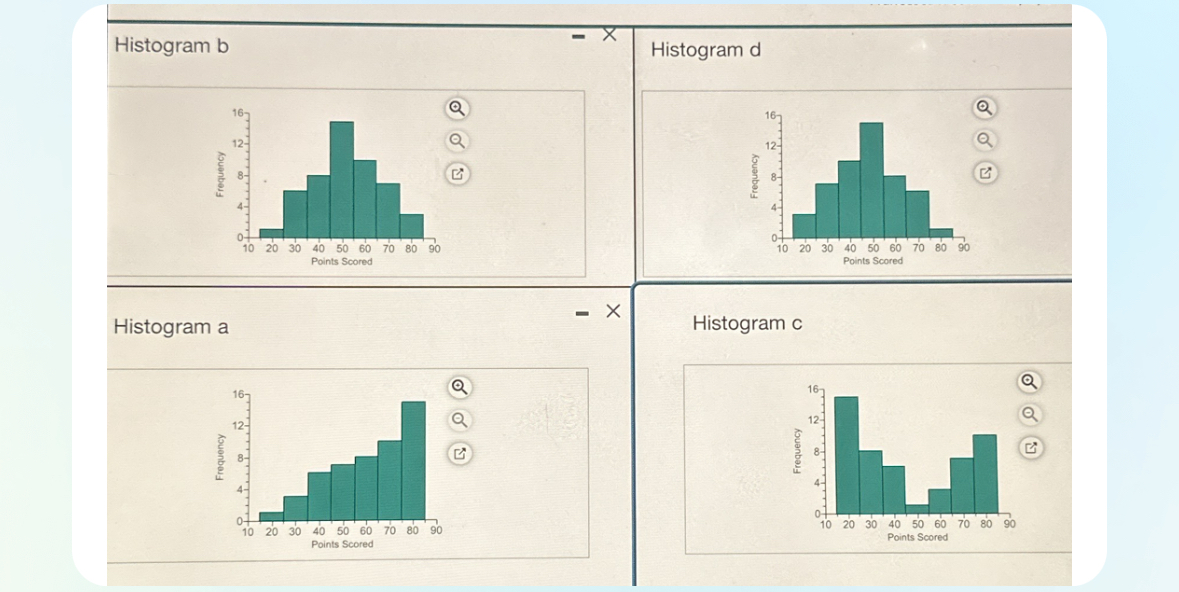
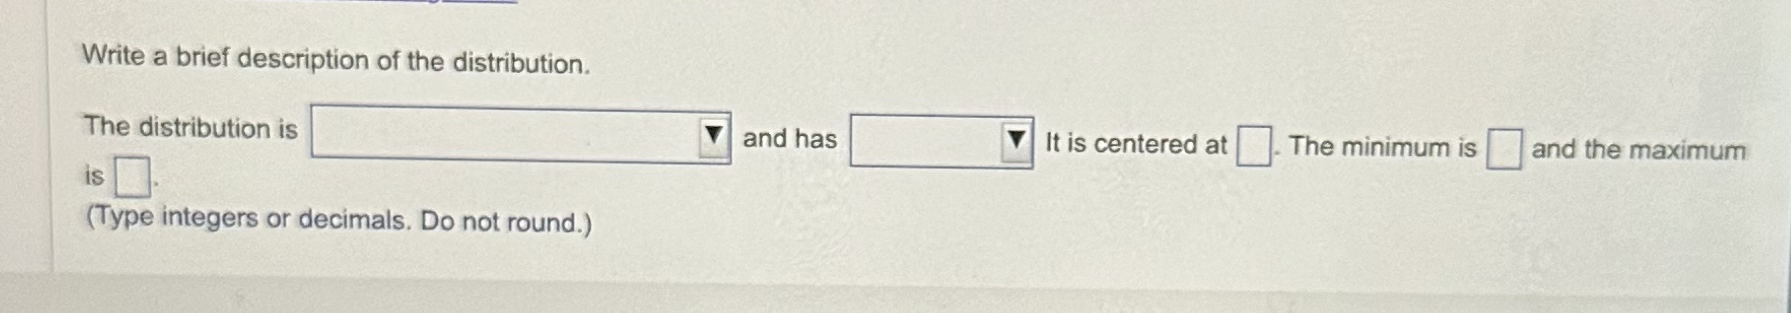
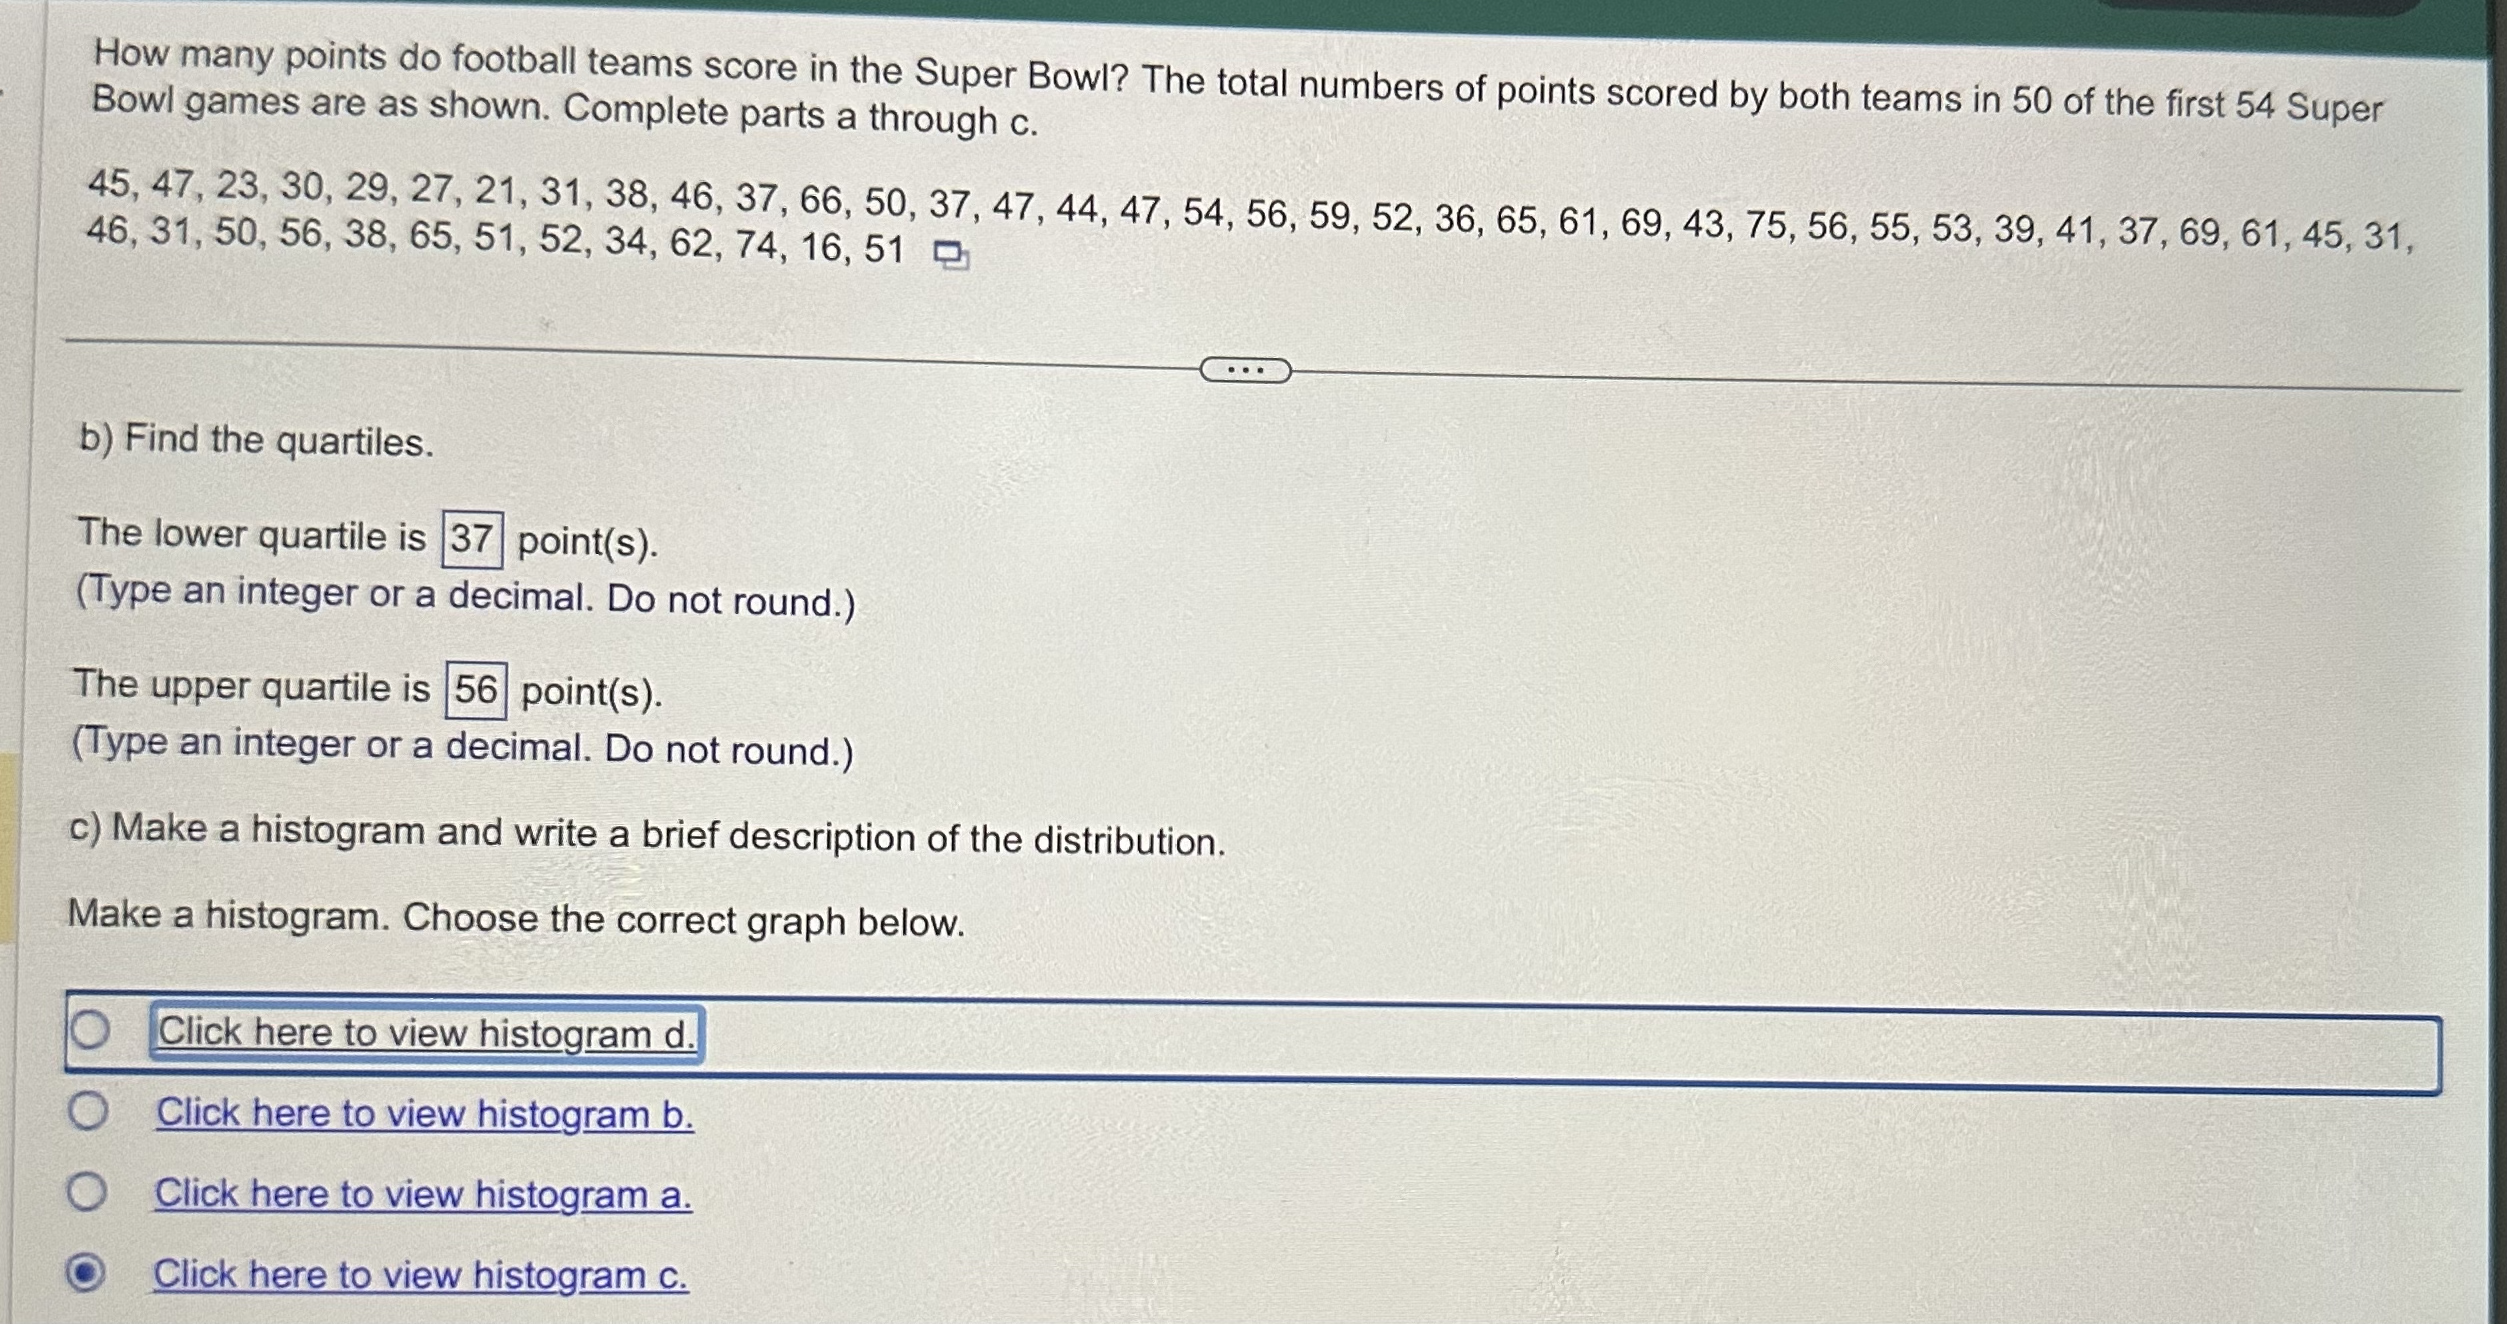
Histogram b Histogram d 16- Q 12- Frequency Frequency 10 20 30 40 50 60 70 80 90 10 20 30 40 50 60 70 80 90 Points Scored Points Scored - X Histogram a Histogram c 167 12- Frequency Frequency 10 20 30 40 50 60 70 80 90 10 20 30 40 50 60 70 80 90 Points Scored Points ScoredWrite a brief description of the distribution. The distribution is and has It is centered at The minimum is and the maximum is (Type integers or decimals. Do not round.)How many points do football teams score in the Super Bowl? The total numbers of points scored by both teams in 50 of the first 54 Super Bowl games are as shown. Complete parts a through c. 45, 47, 23, 30, 29, 27, 21, 31, 38, 46, 37, 66, 50, 37, 47, 44, 47, 54, 56, 59, 52, 46, 31, 50, 56, 38, 65, 51, 52, 34, 62, 74,16, 51 36, 65, 61, 69, 43, 75, 56, 55, 53, 39, 41, 37, 69, 61, 45, 31, b) Find the quartiles. The lower quartile is point(s). (Type an integer or a decimal. Do not round.) The upper quartile is point(s). (Type an integer or a decimal. Do not round.) c) Make a histogram and write a brief description of the distribution. Make a histogram. Choose the correct graph below. () [IClick here to view histogram d. (O Click here to view histogram b. (O Click here to view histogram a. Click here to view histogram c
Step by Step Solution
There are 3 Steps involved in it

Get step-by-step solutions from verified subject matter experts