

Question: Which histogram depicts a higher standard deviation? q 10 Frequency 30 40 50 60 70 (a) Choose the correct answer below. OA. Histogram b
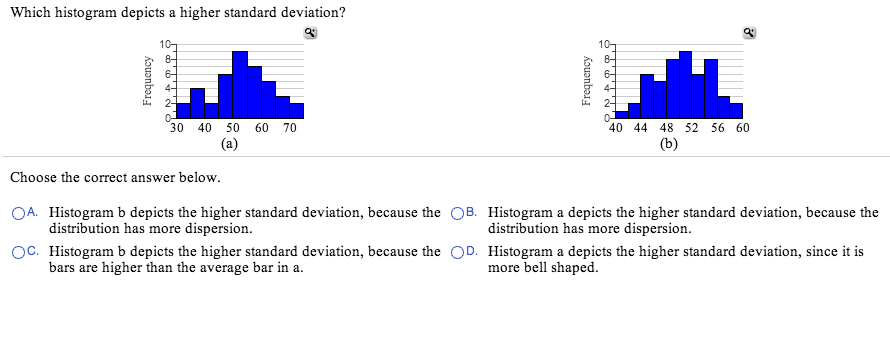
Which histogram depicts a higher standard deviation? q 10 Frequency 30 40 50 60 70 (a) Choose the correct answer below. OA. Histogram b depicts the higher standard deviation, because the OB. distribution has more dispersion. OC. Histogram b depicts the higher standard deviation, because the OD. bars are higher than the average bar in a. Frequency 10- 8- 6- IL 40 44 48 52 56 60 (b) Histogram a depicts the higher standard deviation, because the distribution has more dispersion. Histogram a depicts the higher standard deviation, since it is more bell shaped.
Step by Step Solution
3.40 Rating (150 Votes )
There are 3 Steps involved in it
The detailed answer for the above question is prov... View full answer

Get step-by-step solutions from verified subject matter experts