

Question: Historical data on realized returns is often used to estimate future results. Analysts across companies use realized stock returns to estimate the risk of a
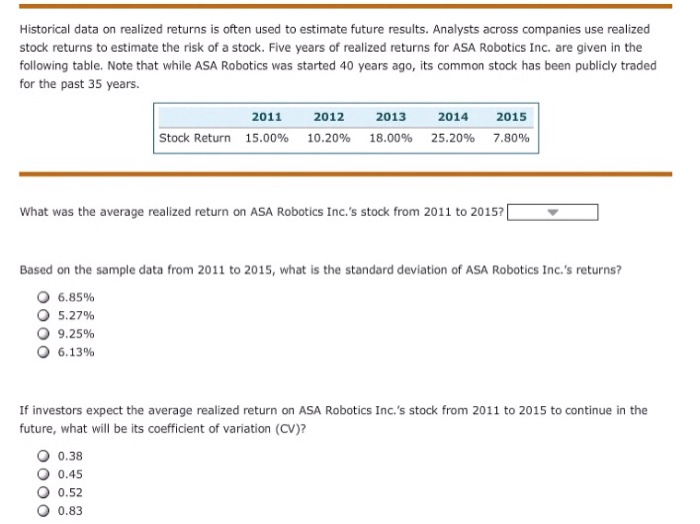
Historical data on realized returns is often used to estimate future results. Analysts across companies use realized stock returns to estimate the risk of a stock. Five years of realized returns for ASA Robotics Inc. are given in the following table. Note that while ASA Robotics was started 40 years ago, its common stock has been publicly traded for the past 35 years. 2011 2012 2013 2014 2015 Stock Return 15.00% 10.20% 18.00% 25.20% 7.80% What was the average realized return on ASA Robotics Inc.'s stock from 2011 to 20157 Based on the sample data from 2011 to 2015, what is the standard deviation of ASA Robotics Inc.'s returns? 6.85% 5.27% 9.25% 6.13% If investors expect the average realized return on ASA Robotics Inc.'s stock from 2011 to 2015 to continue in the future, what will be its coefficient of variation (CV)? O 0.38 0.45 O 0.52 O 0.83
Step by Step Solution
There are 3 Steps involved in it

Get step-by-step solutions from verified subject matter experts