

Question: History Bookmarks Window Help . . . mathxl.com Take a Test - Rita Casco Bb ** MyLab Statistics *- 2021SP-MATH-... P Do Homework - Homework:
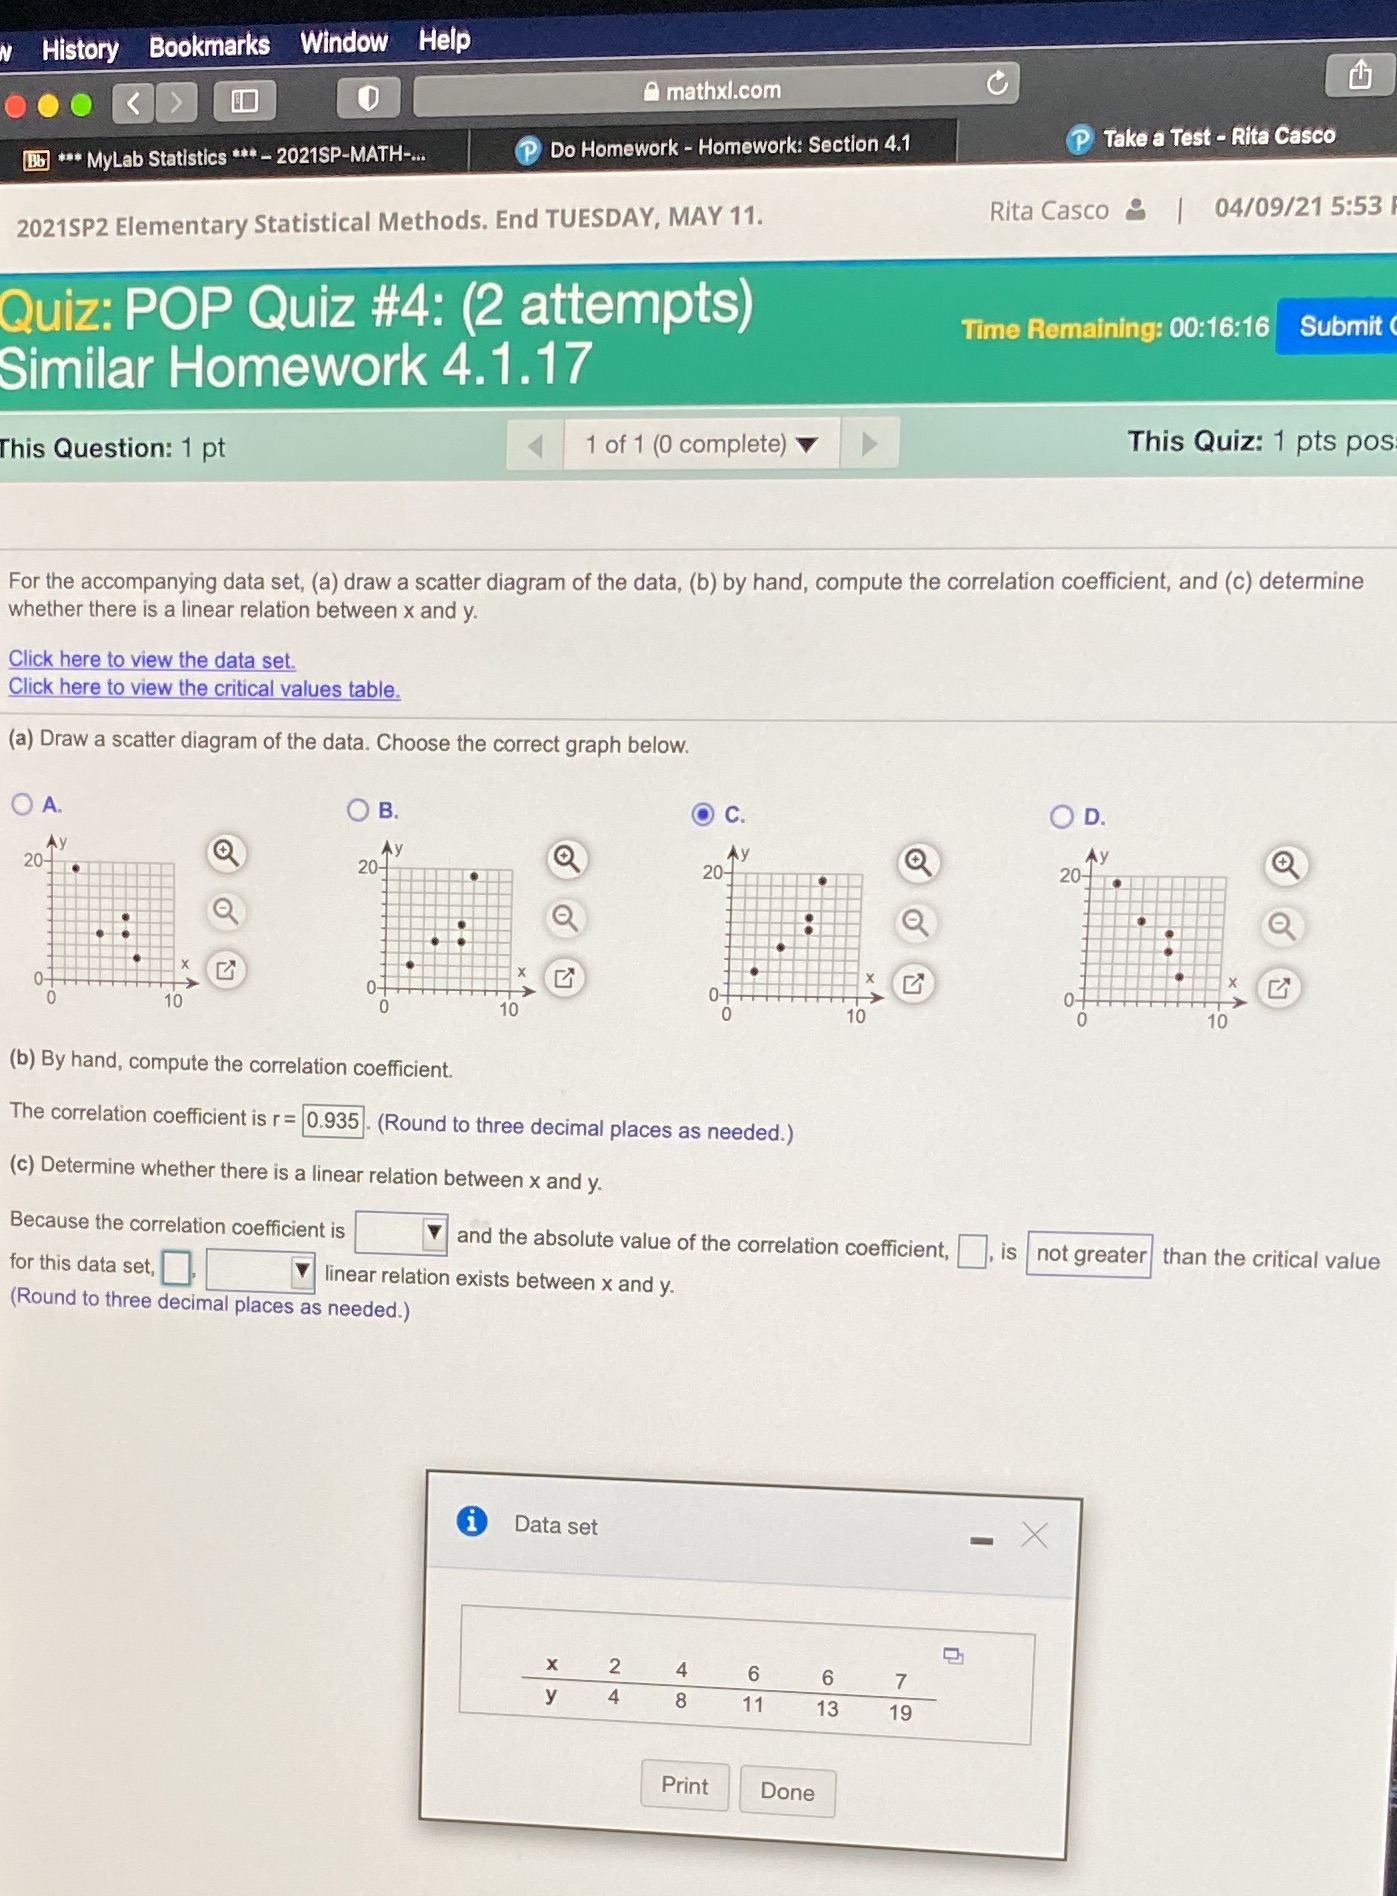
History Bookmarks Window Help . . . mathxl.com Take a Test - Rita Casco Bb ** MyLab Statistics *- 2021SP-MATH-... P Do Homework - Homework: Section 4.1 Rita Casco & | 04/09/21 5:53 2021SP2 Elementary Statistical Methods. End TUESDAY, MAY 11. Quiz: POP Quiz #4: (2 attempts) Time Remaining: 00:16:16 Submit Similar Homework 4.1.17 4 1 of 1 (0 complete) This Quiz: 1 pts pos This Question: 1 pt For the accompanying data set, (a) draw a scatter diagram of the data, (b) by hand, compute the correlation coefficient, and (c) determine whether there is a linear relation between x and y. Click here to view the data set. Click here to view the critical values table. (a) Draw a scatter diagram of the data. Choose the correct graph below. O A. O B. O C. O D. 20- 20- 20- 20- 10 10 10 (b) By hand, compute the correlation coefficient. The correlation coefficient is r= 0.935 . (Round to three decimal places as needed.) (c) Determine whether there is a linear relation between x and y. Because the correlation coefficient is and the absolute value of the correlation coefficient, , is not greater than the critical value for this data set, linear relation exists between x and y. Round to three decimal places as needed.) Data set - X 2 4 6 6 7 y 4 11 13 19 Print Done
Step by Step Solution
There are 3 Steps involved in it

Get step-by-step solutions from verified subject matter experts