

Question: Home Insert Cut Page Layout Formulas Data Review View Helvetica N... 8 A A = Copy Paste BIU A MATH 201_Hypothesis Test Sheet -
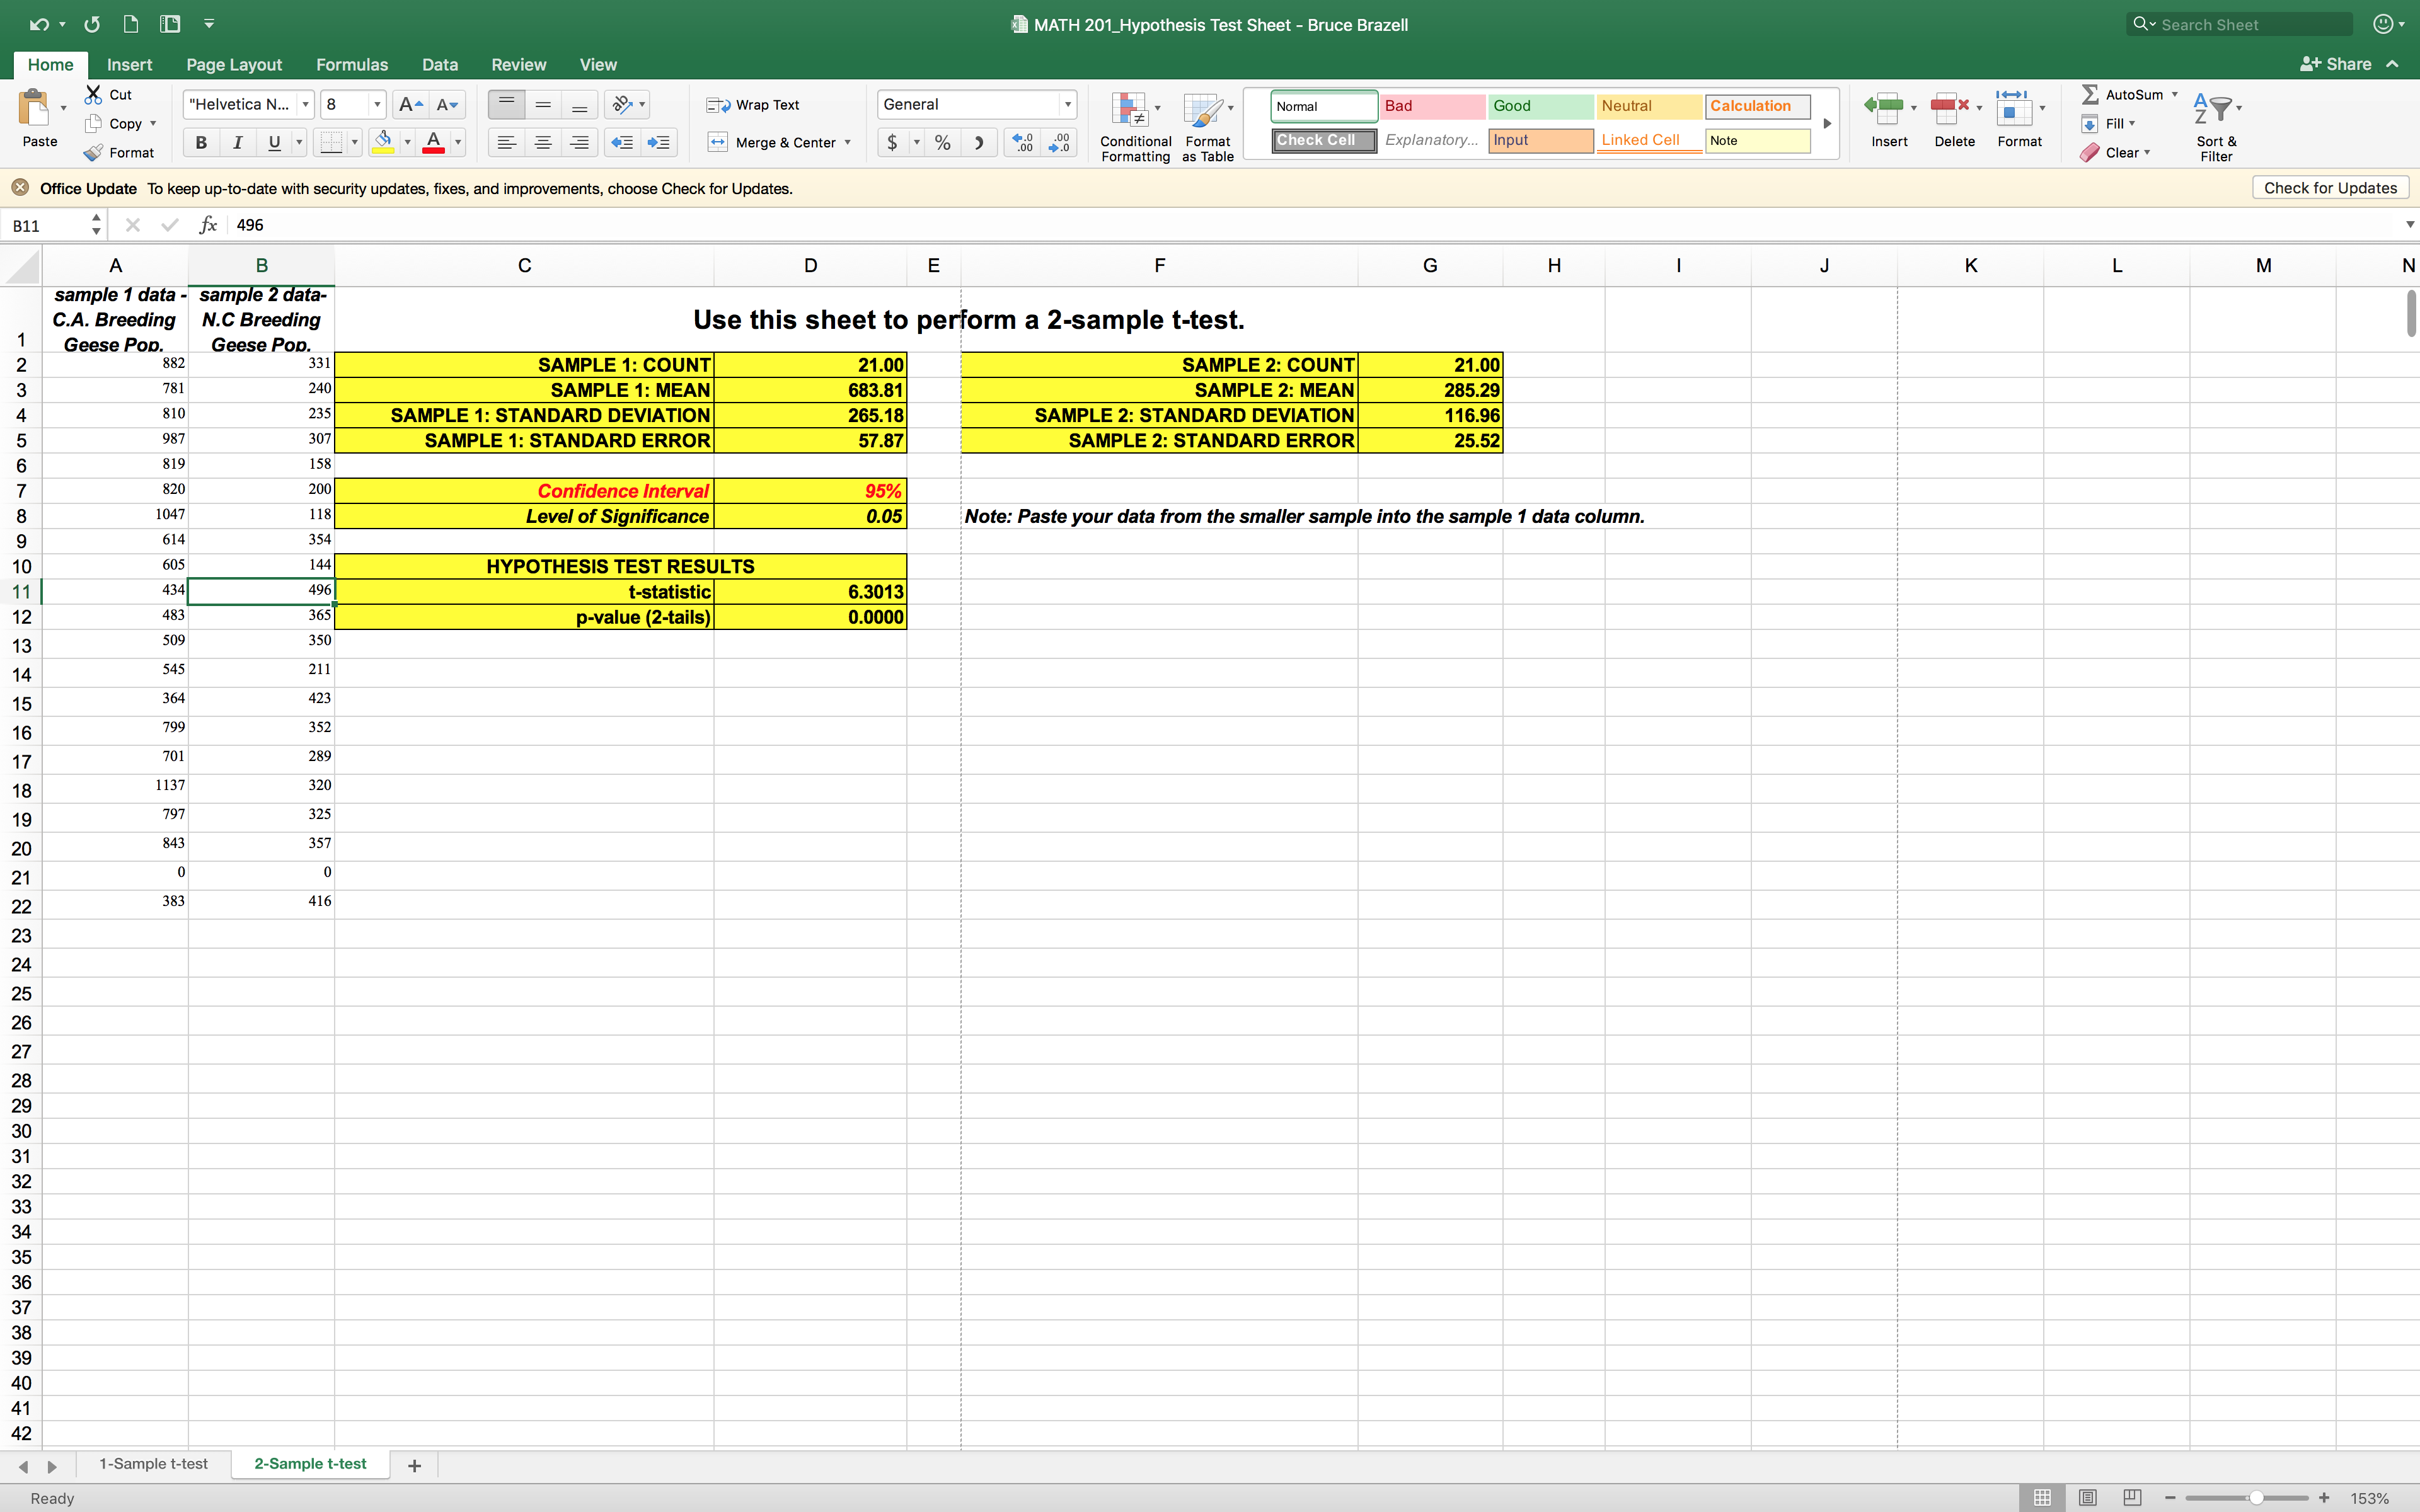

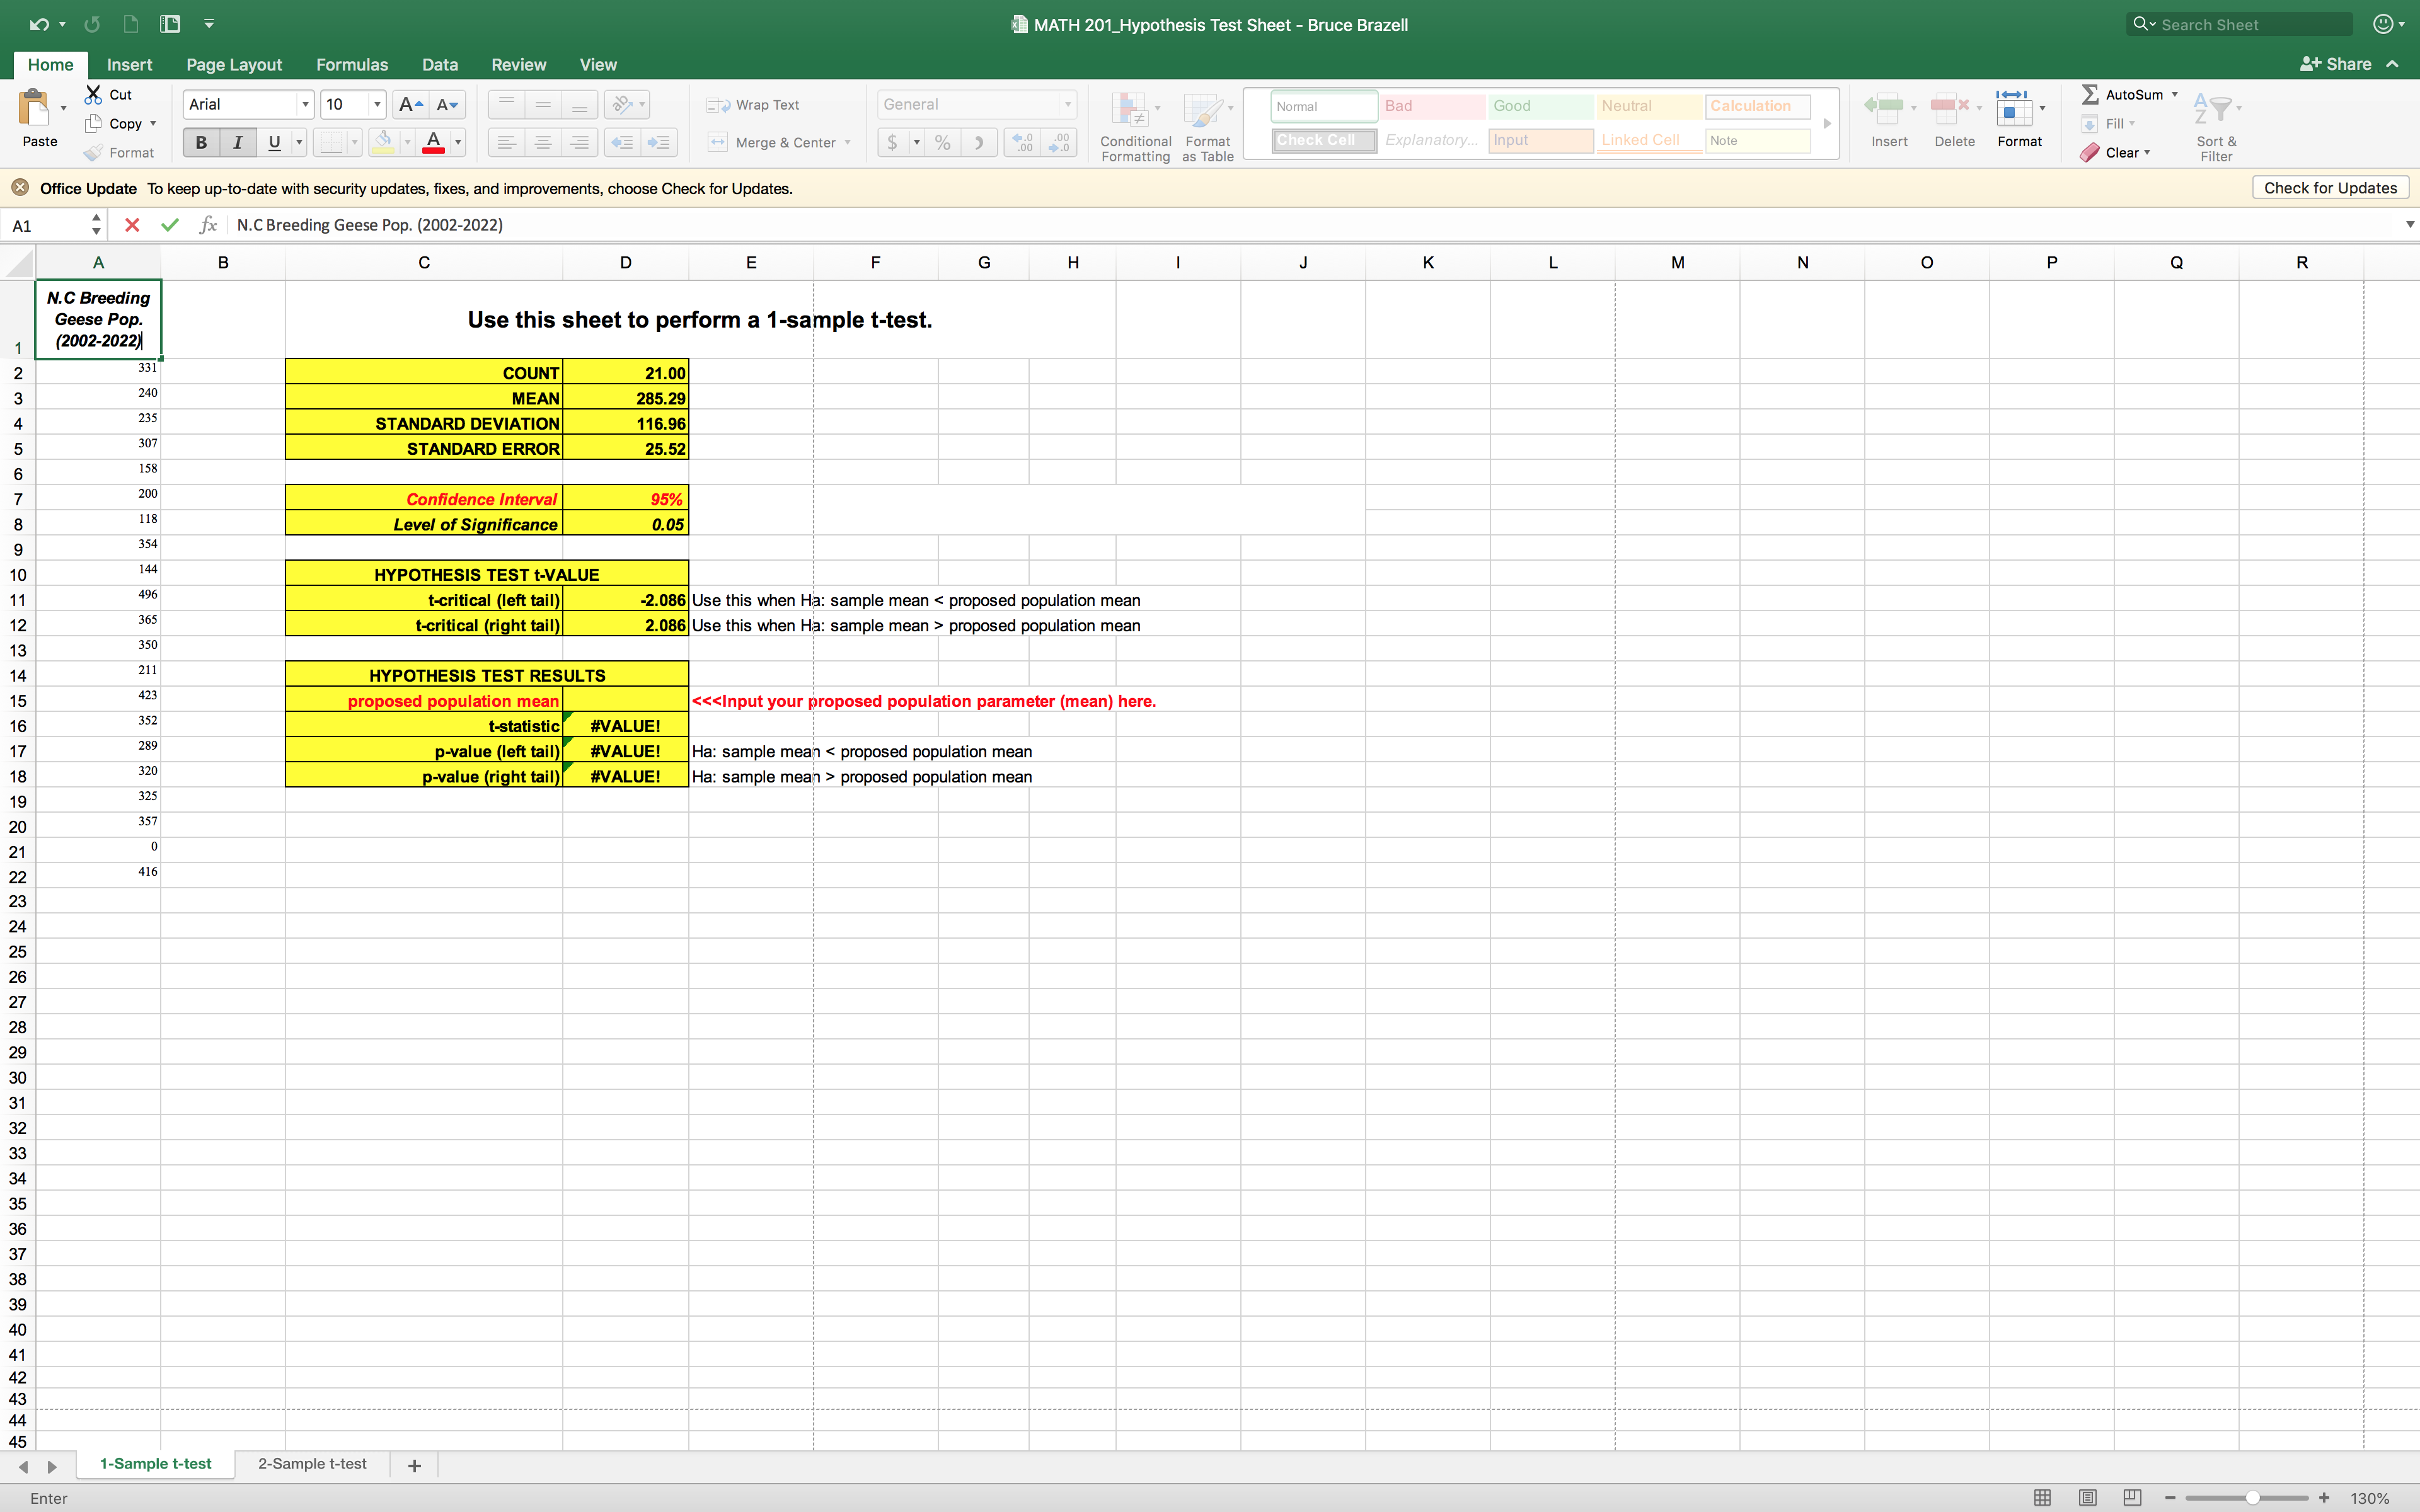
Home Insert Cut Page Layout Formulas Data Review View "Helvetica N... 8 A A = Copy Paste BIU A MATH 201_Hypothesis Test Sheet - Bruce Brazell Q Search Sheet Share ^ II Wrap Text General Normal Bad Good Neutral Calculation Autosum Fill - ND Merge & Center % > .00 +.0 .00 -.0 Conditional Format Formatting as Table Check Cell Explanatory... Input Linked Cell Note Insert Delete Format Clear Sort & Filter Format Office Update To keep up-to-date with security updates, fixes, and improvements, choose Check for Updates. Check for Updates G H | J K L M N B11 fx 496 A B C D E F sample 1 data - sample 2 data- C.A. Breeding N.C Breeding Use this sheet to perform a 2-sample t-test. 1234567 Geese Pop. Geese Pop. 882 331 SAMPLE 1: COUNT 21.00 SAMPLE 2: COUNT 21.00 781 240 SAMPLE 1: MEAN 683.81 SAMPLE 2: MEAN 285.29 810 235 SAMPLE 1: STANDARD DEVIATION 265.18 SAMPLE 2: STANDARD DEVIATION 116.96 987 307 SAMPLE 1: STANDARD ERROR 57.87 SAMPLE 2: STANDARD ERROR 25.52 819 158 820 200 Confidence Interval 95% 88 8 1047 118 Level of Significance 0.05 Note: Paste your data from the smaller sample into the sample 1 data column. 9 614 354 10 605 144 HYPOTHESIS TEST RESULTS 11 12 13 14 15 16 17 1234567 434 496 t-statistic 6.3013 483 365 p-value (2-tails) 0.0000 509 350 545 211 364 423 799 352 701 289 1137 320 18 797 325 19 843 357 20 0 0 21 383 416 22 24 25 26 28 29 30 34 35 36 38 39 40 41 42 22222223223233333712 1-Sample t-test 2-Sample t-test Ready + + 153% MATH 201_Hypothesis Test Sheet - Bruce Brazell Arial Home Insert Cut Page Layout Formulas Data Review View 10 A A Wrap Text General Normal Bad Good Neutral Calculation Copy Paste B I U Merge & Center % proposed population mean 799 701 1137 t-statistic p-value (left tail) p-value (right tail) #VALUE! #VALUE! #VALUE! | < < proposed population mean 797 19 843 20 0 383 Enter 1-Sample t-test 2-Sample t-test + J K L M N Q Search Sheet Share ^ II Autosum Fill Insert Delete Format Clear P AN Sort & Filter Check for Updates R + 130% MATH 201_Hypothesis Test Sheet - Bruce Brazell Arial Home Insert Cut Page Layout Formulas Data Review View 10 A A Wrap Text General Normal Bad Good Neutral Calculation Copy Paste B I U Merge & Center % proposed population mean 352 289 320 t-statistic p-value (left tail) p-value (right tail) #VALUE! #VALUE! #VALUE! | < < proposed population mean 325 19 357 20 0 416 Enter 1-Sample t-test 2-Sample t-test + J K L M N Q Search Sheet Share ^ II Autosum Fill Insert Delete Format Clear P AN Sort & Filter Check for Updates R + 130%
Step by Step Solution
There are 3 Steps involved in it

Get step-by-step solutions from verified subject matter experts