

Question: Home Insert Draw Design Layout References Mailings Review View Help Comments LO Viewing Share File Home e Insert Page Layout Formulas Data Review View Help
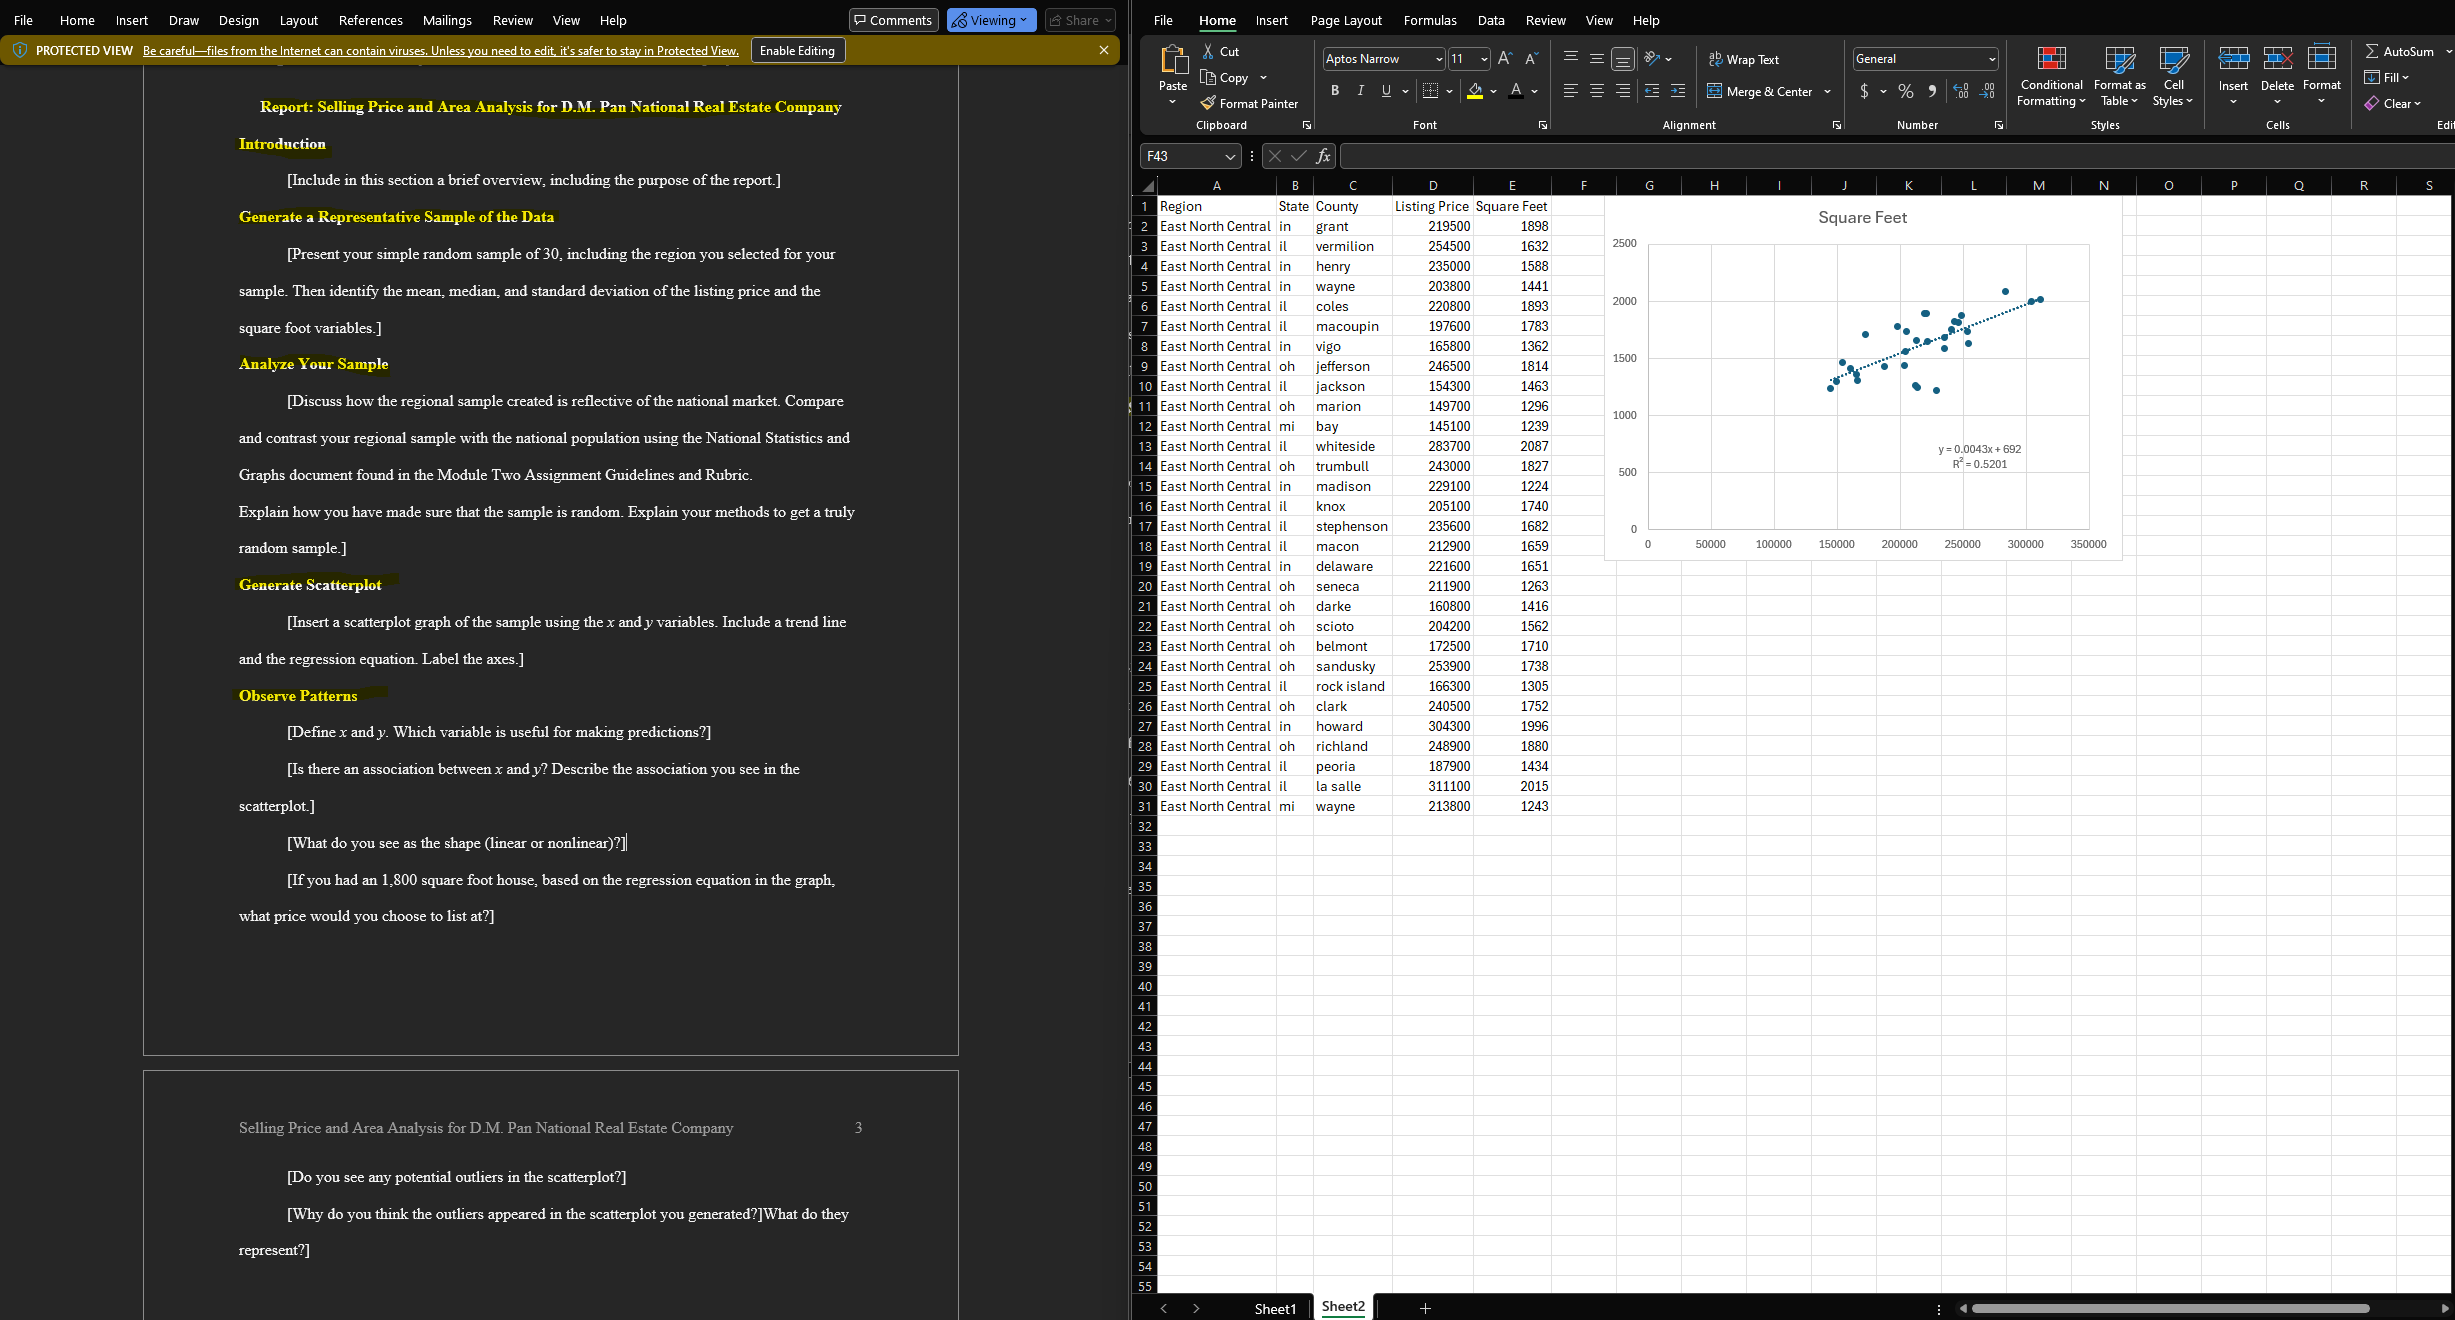
Home Insert Draw Design Layout References Mailings Review View Help Comments LO Viewing Share File Home e Insert Page Layout Formulas Data Review View Help PROTECTED VIEW Be careful files from the Internet can contain viruses. Unless you need to edit, it's safer to stay in Protected View. Enable Editing Cut Aptos Narrow AA 29 Wrap Text Genera AutoSum Paste LG Copy Fill ~ BIU FLAV Merge & Center ~ $ ~ % 9 68 98 Conditional Format as Cell Insert Delete Format Report: Selling Price and Area Analysis for D.M. Pan National Real Estate Company Format Painter Formatting Table Styles Clear ~ Clipboard Font Alignment Number Styles Cells Introduction F43 vi X fx [Include in this section a brief overview, including the purpose of the report.] G M Generate a Representative Sample of the Data Region State County Listing Price Square Feet East North Central in grant 219500 1898 Square Feet East North Central il vermilion 2500 [Present your simple random sample of 30, including the region you selected for your 25450 1632 East North Central in henry 235000 1588 sample. Then identify the mean, median, and standard deviation of the listing price and the 5 East North Central in wayne 0380 144 East North Central il coles 22080 189 2000 square foot variables.] East North Central il macoupin 97600 1783 8 East North Central in vigo 6580 1362 Analyze Your Sample 1500 9 East North Central oh jefferson 246500 1814 10 East North Central il jackson 154300 1463 Discuss how the regional sample created is reflective of the national market. Compare East North Central oh marion 149700 1296 1000 145100 1239 and contrast your regional sample with the national population using the National Statistics and 12 East North Central mi bay East North Central il whiteside 283700 2087 = 0.0043x + 692 14 East North Central oh trumbull '43000 1827 500 R = 0.5201 Graphs document found in the Module Two Assignment Guidelines and Rubric 15 East North Central in madison 229100 1224 Explain how you have made sure that the sample is random. Explain your methods to get a truly East North Central il knox 0510 1740 17 East North Central il stephenson 3560 1682 random sample.] 18 East North Central il macon 21290 1659 50000 100000 150000 200000 250000 300000 350000 19 East North Central in delaware 22160 1651 Generate Scatterplot 20 East North Central oh seneca 211900 1263 21 East North Central oh dark 16080 1416 Insert a scatterplot graph of the sample using the x and y variables. Include a trend line East North Central oh scioto 204200 1562 23 East North Central oh belmont 172500 1710 and the regression equation. Label the axes.] East North Central oh sandusky 25390 1738 25 1305 Observe Patterns East North Central il rock island 166300 East North Central oh clark 24050 1752 [Define x and y. Which variable is useful for making predictions?] 27 East North Central in howard 0430 1996 28 East North Central oh richland 4890 1880 [Is there an association between x and y? Describe the association you see in the 29 East North Central il peoria 187900 1434 30 East North Central il la salle 311100 2015 scatterplot.] 31 East North Central mi wayne 213800 1243 32 [What do you see as the shape (linear or nonlinear)?]| [If you had an 1,800 square foot house, based on the regression equation in the graph, what price would you choose to list at?] Selling Price and Area Analysis for D.M. Pan National Real Estate Company [Do you see any potential outliers in the scatterplot?] [Why do you think the outliers appeared in the scatterplot you generated?]What do they represent?] Sheet1 Sheet2 +
Step by Step Solution
There are 3 Steps involved in it

Get step-by-step solutions from verified subject matter experts