

Question: Home Insert Draw Page Layout Formulas Data Review View Automate Tell me Comments LE Shar Arial 10 A A ab General Conditional Formatting Insert v
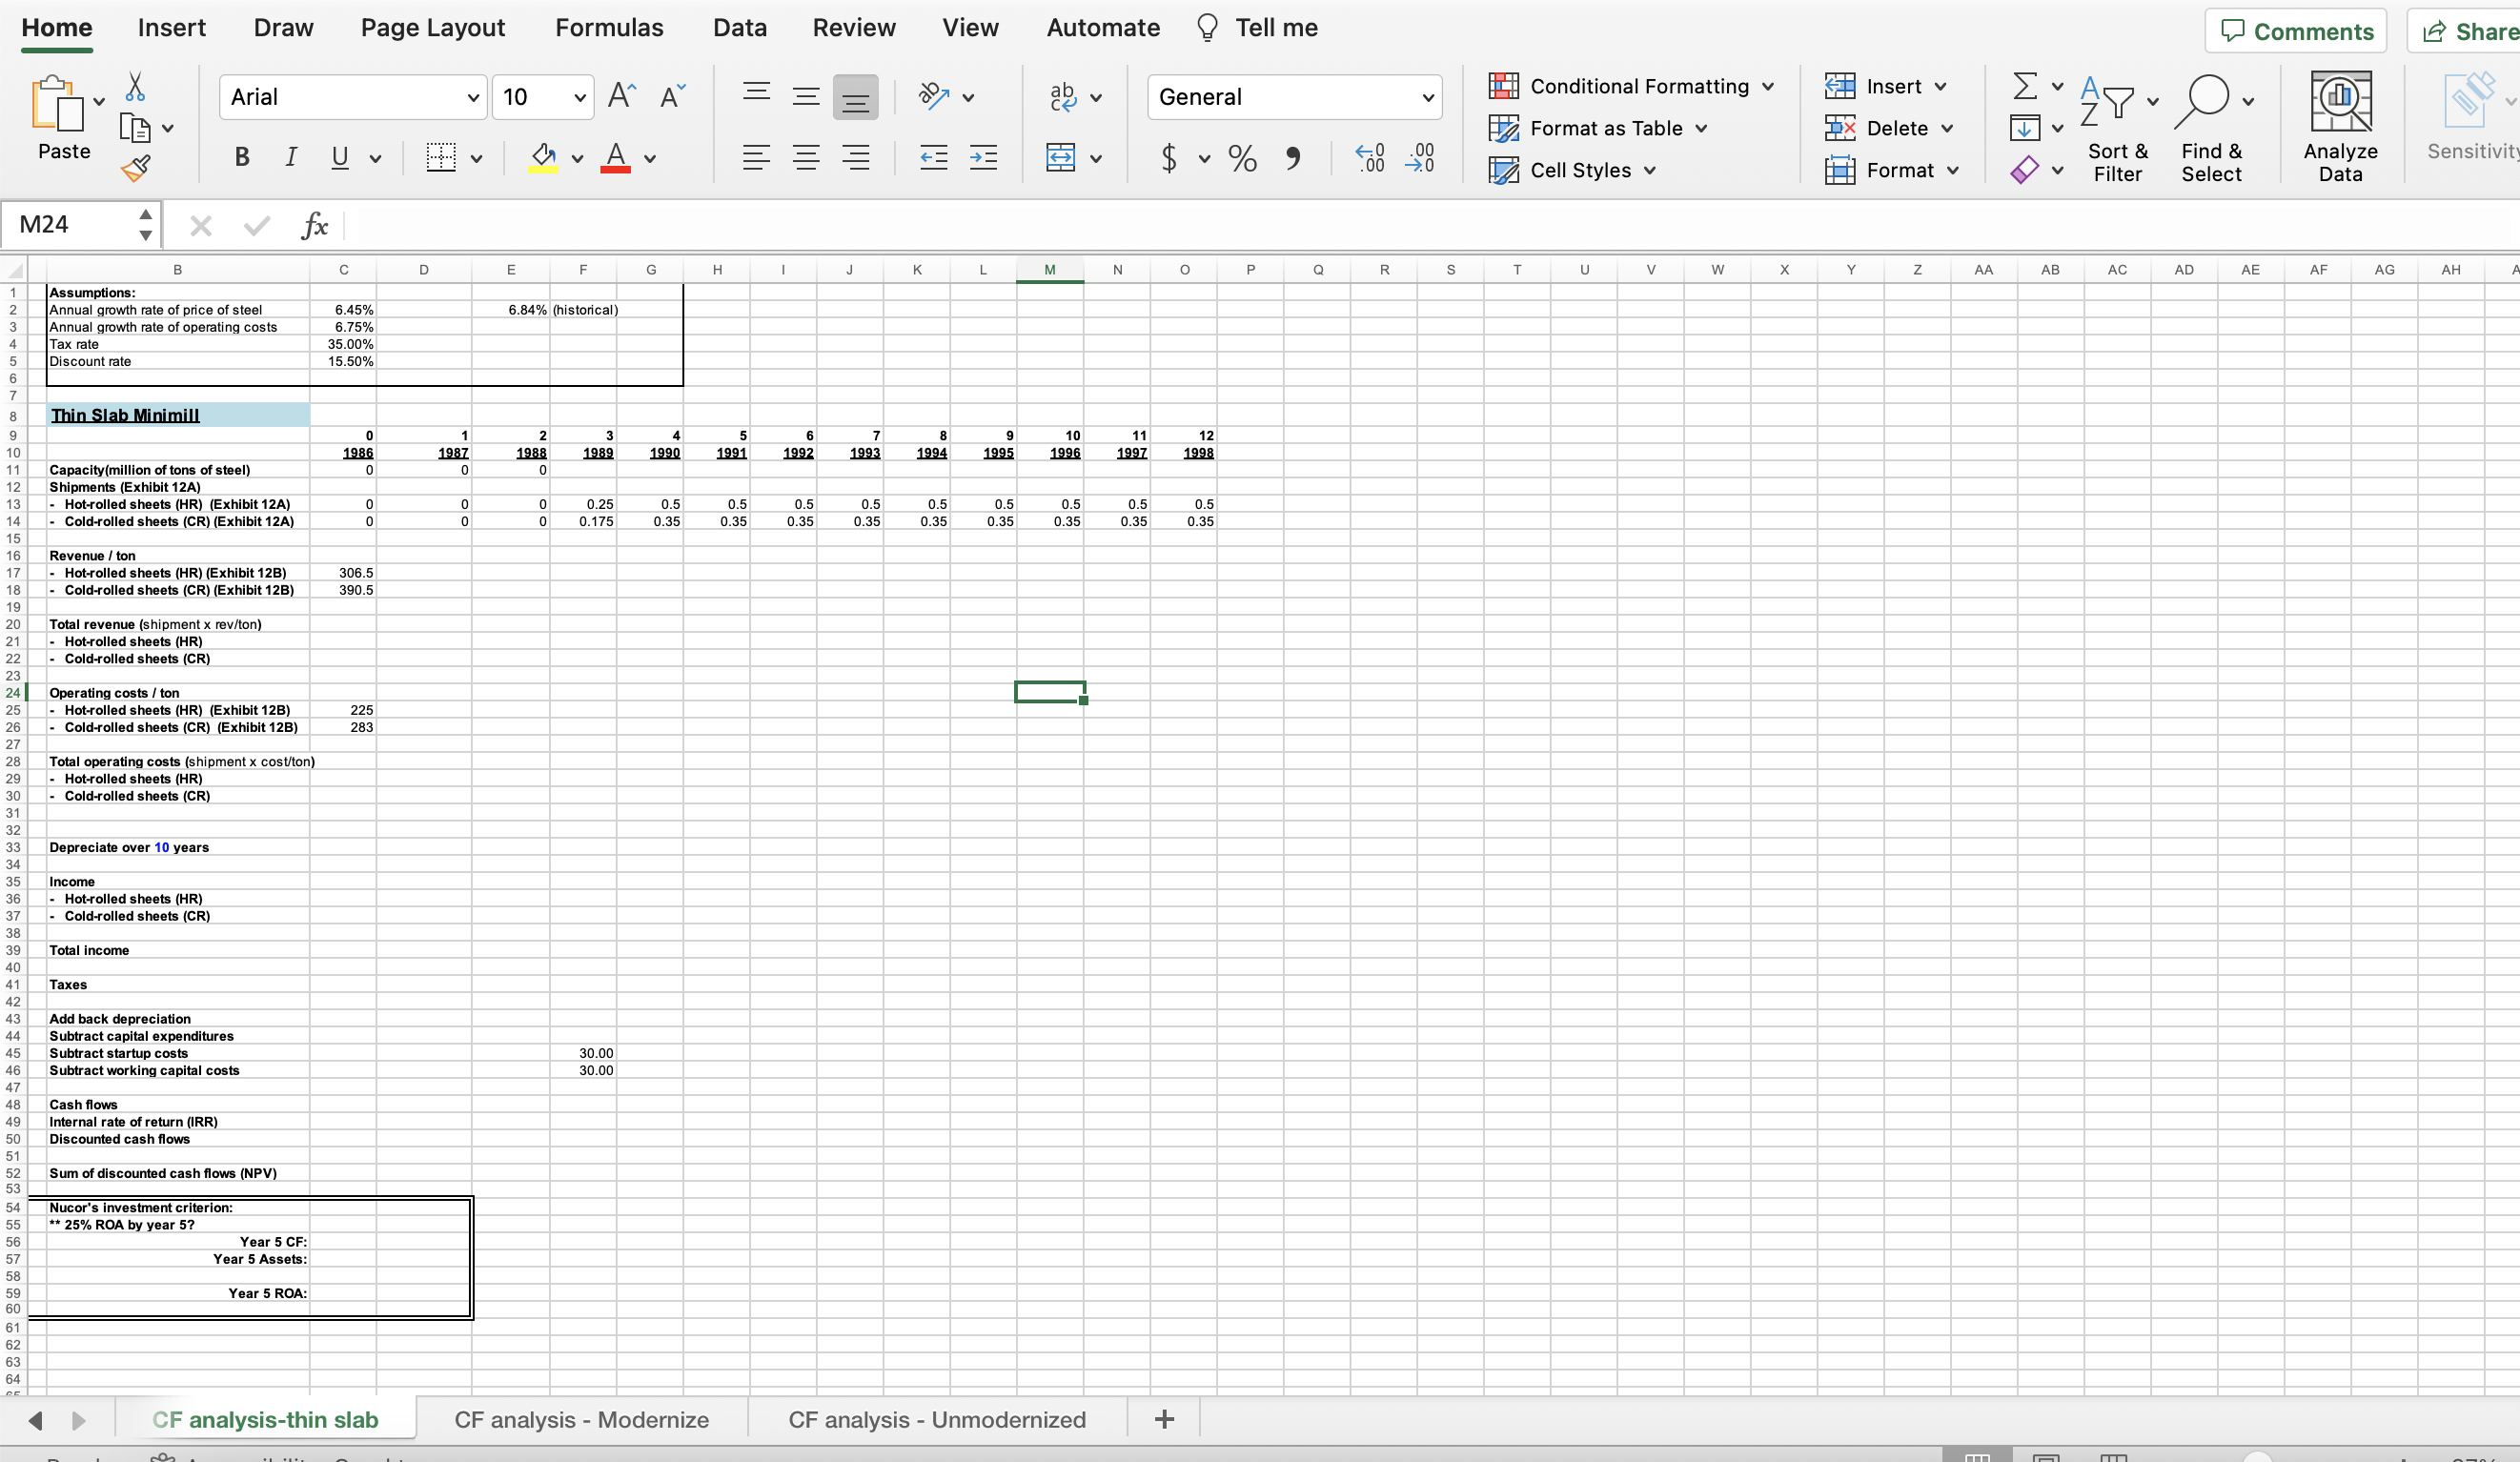
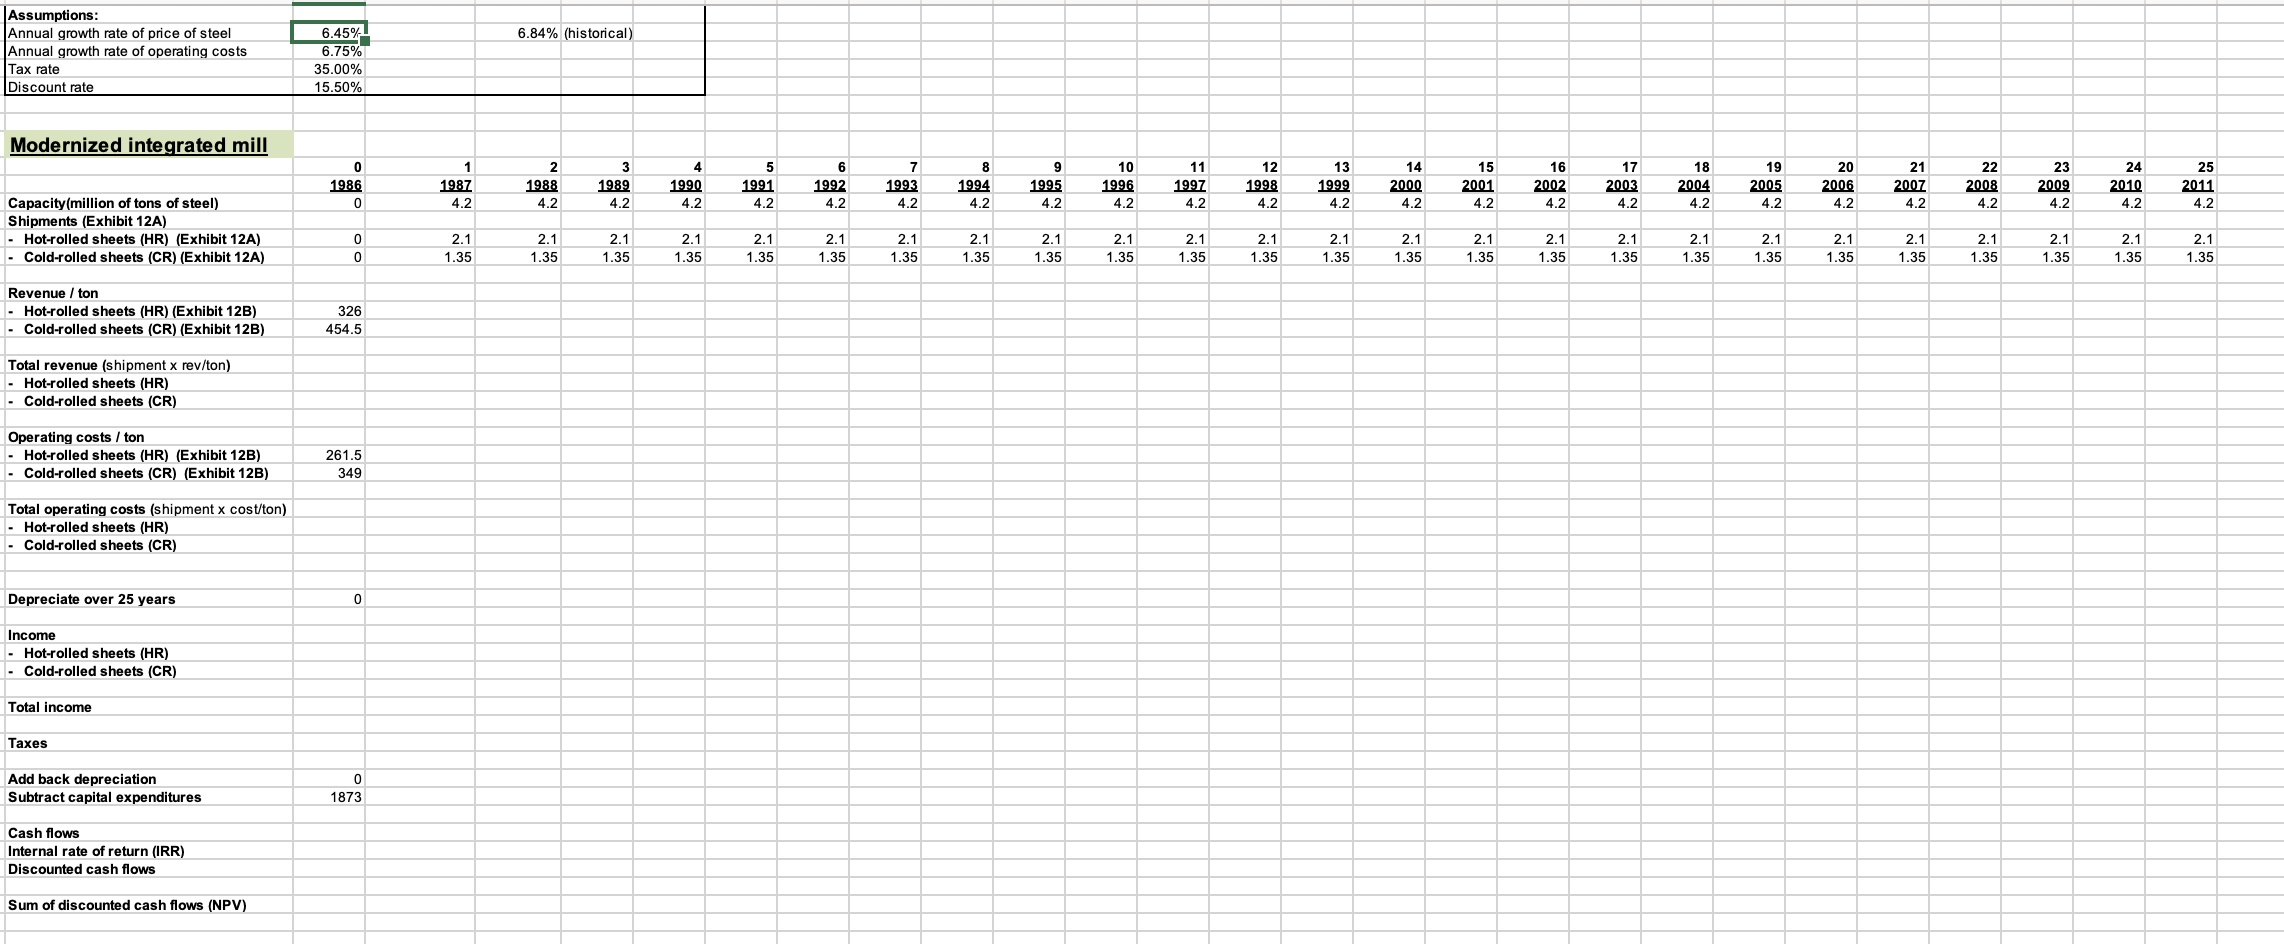
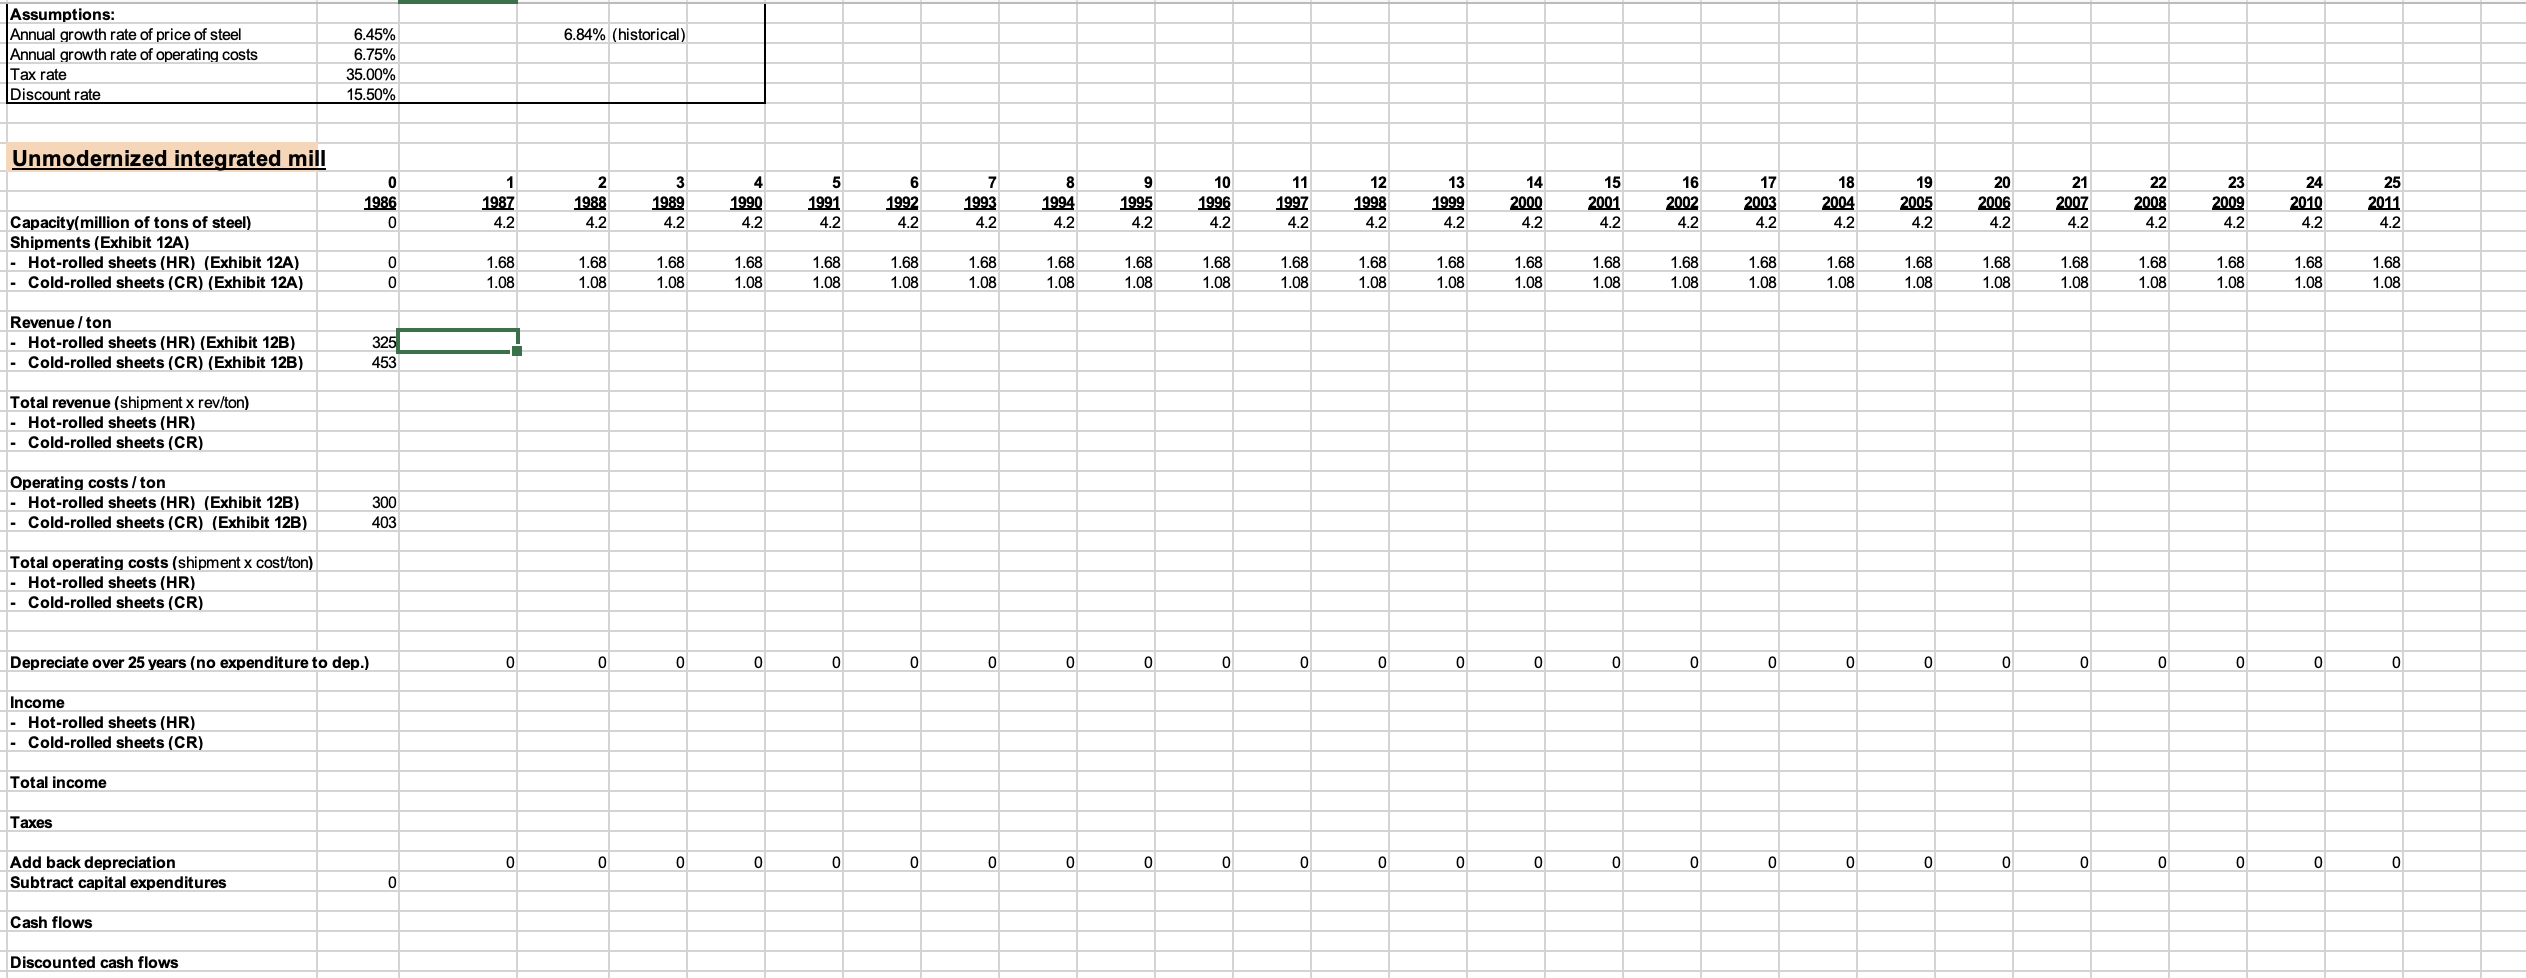
Home Insert Draw Page Layout Formulas Data Review View Automate Tell me Comments LE Shar Arial 10 A A ab General Conditional Formatting Insert v ZY A Format as Table Ex Delete v MY ZY- O Paste BIUV MvAv $ ~ % 9 Sort & Find & Analyze Sensitivit Cell Styles v Format v Filter Select Data M24 X V fx D E F G H J K L M N o P Q R S T U v w X Y Z AA AB AC AD AE AF AG AH |Assumptions: Annual growth rate of price of steel 6.45% 6.84% (historical) Annual growth rate of operating costs 6:10 70 Tax rate 35.009 Discount rate 15.50% Thin Slab Minimill 2 3 6 7 1991 8 9 10 11 12 1986 1987 1988 1989 1990 1992 1993 1994 1995 1996 1997 1998 Capacity(million of tons of steel) Shipments (Exhibit 12A) - Hot-rolled sheets (HR) (Exhibit 12A) 0.25 0.5 0.5 0.5 0.5 O. 0.5 0.5 0.5 0.5 OC - Cold-rolled sheets (CR) (Exhibit 12A) 0.175 0.35 1.35 0.35 135 35 0.35 0.35 0.35 0.35 Revenue / ton - Hot-rolled sheets (HR) (Exhibit 12B) 306.5 Cold-rolled sheets (CR) (Exhibit 12B) 390.5 Total revenue (shipment x rev/ton) Hot-rolled sheets (HR) - Cold-rolled sheets (CR) Operating costs / ton t-rolled sheets (HR) 225 Cold-rolled sheets (CR) (Exhibit 12B 283 Total operating costs (shipment x cost/ton) Hot-rolled sheets (HR) - Cold-rolled sheets (CR Depreciate over 10 years Income - Hot-rolled sheets (HR) - Cold-rolled sheets (CR) Total income Taxes Add back depreciation Subtract capital expenditures Subtract startup costs 30.00 Subtract working capital costs 30.00 Cash flows Internal rate of return (IRR) Discounted cash flows Sum of discounted cash flows (NPV) Nucor's investment criterion: * 25% ROA by year 5? Year 5 CF: Year 5 Assets: Year 5 ROA: D CF analysis-thin slab CF analysis - Modernize CF analysis - Unmodernized +Assumptions: Annual growth rate of price of steel 6.45% 6.84% (historical) Annual growth rate of operating costs 6.75% Tax rate 35.00% Discount rate 15.50% Modernized integrated mill 25 12 13 14 15 16 17 BL 20 21 22 23 24 5 8 10 11 2 3 6 9 1999 2000 2001 2002 2003 2004 2005 2006 2007 2008 2009 2010 2011 4.2 1986 1987 1988 1989 1990 1991 1992 1993 1994 1995 1996 1997 1998 4.2 4.2 4.2 4.2 4.2 42 4.2 42 4.2 4.2 4.2 4.2 4.2 4.2 4.2 4.2 4.2 Capacity(million of tons of steel) 4.2 4.2 4.2 4.2 4.2 4.2 4.2 2.1 2.1 2.1 2.1 2.1 2.1 2.1 2.1 2.1 2.1 2.1 2.1 2.1 2.1 Shipments (Exhibit 12A) 2.1 2.1 2.1 2.1 2.1 2.1 2.1 2.1 2.1 2.1 2.1 1.35 1.35 1.35 1.35 1.35 1.35 1.35 1.35 1.35 1.35 1.35 1.35 1.35 1.35 - Hot-rolled sheets (HR) (Exhibit 12A) 1.35 1.35 1.35 1.35 1.35 1.35 1.35 1.35 1.35 1.35 1.35 Cold-rolled sheets (CR) (Exhibit 12A) Revenue / ton Hot-rolled sheets (HR) (Exhibit 12B) 326 Cold-rolled sheets (CR) (Exhibit 12B) 454.5 Total revenue (shipment x rev/ton) Hot-rolled sheets (HR) Cold-rolled sheets (CR) Operating costs / ton - Hot-rolled sheets (HR) (Exhibit 12B) 261.5 - Cold-rolled sheets (CR) (Exhibit 12B) 349 Total operating costs (shipment x cost/ton) Hot-rolled sheets (HR) Cold-rolled sheets (CR) Depreciate over 25 years 0 Income - Hot-rolled sheets (HR) Cold-rolled sheets (CR) Total income Taxes Add back depreciation 0 Subtract capital expenditures 1873 Cash flows Internal rate of return (IRR) Discounted cash flows Sum of discounted cash flows (NPV)Assumptions: 6.45% 6.84% (historical) Annual growth rate of price of steel Annual growth rate of operating costs 6.75% Tax rate 35.00% Discount rate 15.50% 25 18 19 21 24 20 22 23 Unmodernized integrated mill 9 10 11 12 13 14 15 16 17 2007 2008 2009 2010 2011 5 6 7 8 2001 2002 2003 2004 2005 2006 4.2 4.2 4.2 1 2 3 1995 1996 1997 1998 1999 2000 42 4.2 42 42 42 1986 1987 1988 1989 1990 1991 1992 1993 1994 4.2 4.2 4.2 4.2 4.2 4.2 4.2 42 4.2 4.2 4.2 4.2 4.2 4.2 4.2 42 4.2 1.68 1.68 1.68 1.68 1.68 1.68 Capacity(million of tons of steel) 0 1.68 1.68 1.68 1.68 1.08 1.08 1.68 1.68 1.68 1.68 1.68 1.68 1.68 1.68 1.68 1.08 1.08 1.08 1.08 1.08 1.08 1.08 1.08 Shipments (Exhibit 12A) 1.68 1.68 1.68 1.68 1.68 1.08 1.08 1.08 1.08 1.08 1.08 - Hot-rolled sheets (HR) (Exhibit 12A) 1.68 1.08 1.08 1.08 1.08 1.08 1.08 1.08 1.08 1.08 Cold-rolled sheets (CR) (Exhibit 12A) Revenue / ton - Hot-rolled sheets (HR) (Exhibit 12B) 325 Cold-rolled sheets (CR) (Exhibit 12B) 453 Total revenue (shipment x rev/ton) - Hot-rolled sheets (HR) Cold-rolled sheets (CR) Operating costs / ton Hot-rolled sheets (HR) (Exhibit 12B) 300 Cold-rolled sheets (CR) (Exhibit 12B) 403 Total operating costs (shipment x cost/ton) Hot-rolled sheets (HR) Cold-rolled sheets (CR) 0 0 0 0 0 0 0 0 0 0 0 0 0 0 0 0 0 0 0 0 0 Depreciate over 25 years (no expenditure to dep.) Income - Hot-rolled sheets (HR) - Cold-rolled sheets (CR) Total income 0 0 0 0 0 0 0 0 0 0 Taxes 0 0 0 0 0 0 0 0 0 0 0 0 Add back depreciation Subtract capital expenditures 0 Cash flows Discounted cash flows
Step by Step Solution
There are 3 Steps involved in it

Get step-by-step solutions from verified subject matter experts