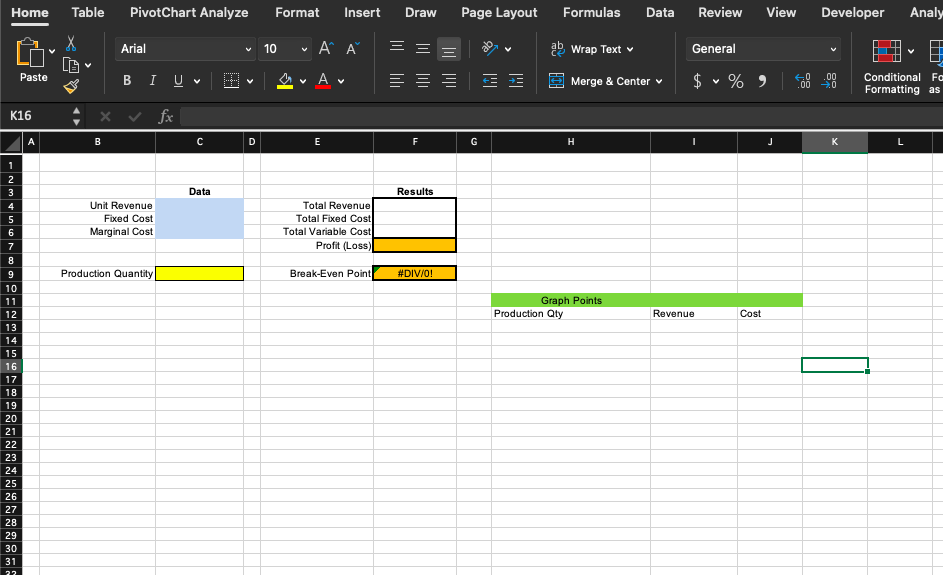
Question: Home Table PivotChart Analyze Format Insert Draw Page Layout Formulas Data Review View Developer Analy Arial Ch 10 ab [G Wrap Text General V Av

Home Table PivotChart Analyze Format Insert DrawHome Table PivotChart Analyze Format Insert Draw

Home Table PivotChart Analyze Format Insert Draw Page Layout Formulas Data Review View Developer Analy Arial Ch 10 ab [G Wrap Text General V Av 1|||||| II III Paste BI V TO TI Merge & Center $ %) V .00 .00 0 Conditional FC Formatting as K16 x fix B C D E F G H J 1 2 3 Data Results 4 Unit Revenue Fixed Cost Marginal Cost Total Revenue Total Fixed Cost otal Variable Cost Profit (Loss) Production Quantity Break-Even Point #DIV/0! Graph Points Production Qty Revenue Cost 5 6 7 8 9 10 11 12 13 14 15 16 17 18 19 20 21 22 23 24 25 26 27 28 29 30 31 22 The product manager for a new haircare product called "turbo is evaluating breakeven points for her organization. She asked you, the analyst, to analyze her situation. The data has been given to you for this evaluation in a worksheet labeled "Haircare Data". The equipment that is used to produce this product is leased for $25,000/year. Using the data, create a pivot table that extracts the marginal costs and revenue for the turbo product 1. What is the break-even point where profit is finally seen? (Ensure answer is in cell C:9) 2. Create a chart showing the crossover of Revenue and Cost. Make sure to appropriately label axis. Start your production quantity with a minimum of 4800 units. Home Table PivotChart Analyze Format Insert Draw Page Layout Formulas Data Review View Developer Analy Arial Ch 10 ab [G Wrap Text General V Av 1|||||| II III Paste BI V TO TI Merge & Center $ %) V .00 .00 0 Conditional FC Formatting as K16 x fix B C D E F G H J 1 2 3 Data Results 4 Unit Revenue Fixed Cost Marginal Cost Total Revenue Total Fixed Cost otal Variable Cost Profit (Loss) Production Quantity Break-Even Point #DIV/0! Graph Points Production Qty Revenue Cost 5 6 7 8 9 10 11 12 13 14 15 16 17 18 19 20 21 22 23 24 25 26 27 28 29 30 31 22 The product manager for a new haircare product called "turbo is evaluating breakeven points for her organization. She asked you, the analyst, to analyze her situation. The data has been given to you for this evaluation in a worksheet labeled "Haircare Data". The equipment that is used to produce this product is leased for $25,000/year. Using the data, create a pivot table that extracts the marginal costs and revenue for the turbo product 1. What is the break-even point where profit is finally seen? (Ensure answer is in cell C:9) 2. Create a chart showing the crossover of Revenue and Cost. Make sure to appropriately label axis. Start your production quantity with a minimum of 4800 units

Step by Step Solution

There are 3 Steps involved in it

1 Expert Approved Answer
Step: 1 Unlock blur-text-image
Question Has Been Solved by an Expert!

Get step-by-step solutions from verified subject matter experts

Step: 2 Unlock
Step: 3 Unlock

Students Have Also Explored These Related General Management Questions!