

Question: HOMEWORK 1. Use the data on Table 6.3 in the book (shown below). Table 6-3 Monthly Holding-Period Returns, eBay versus the S&P 500 Index, June
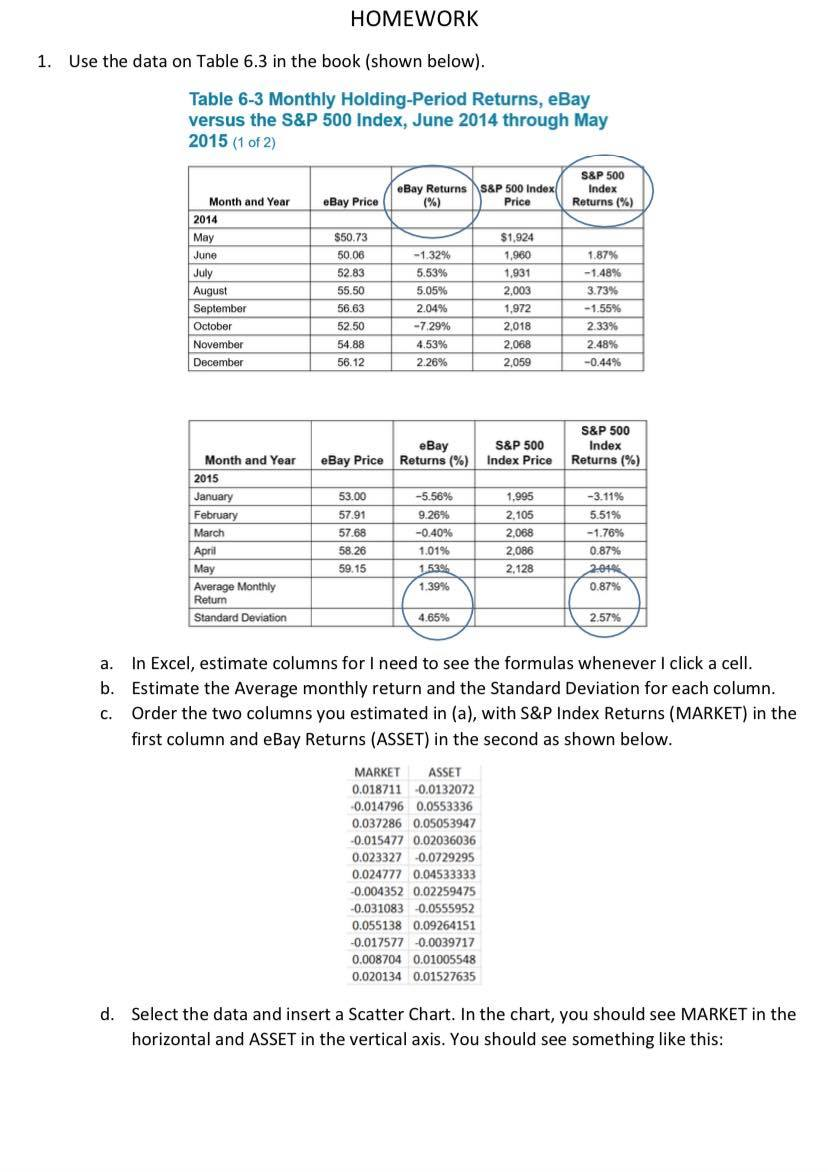
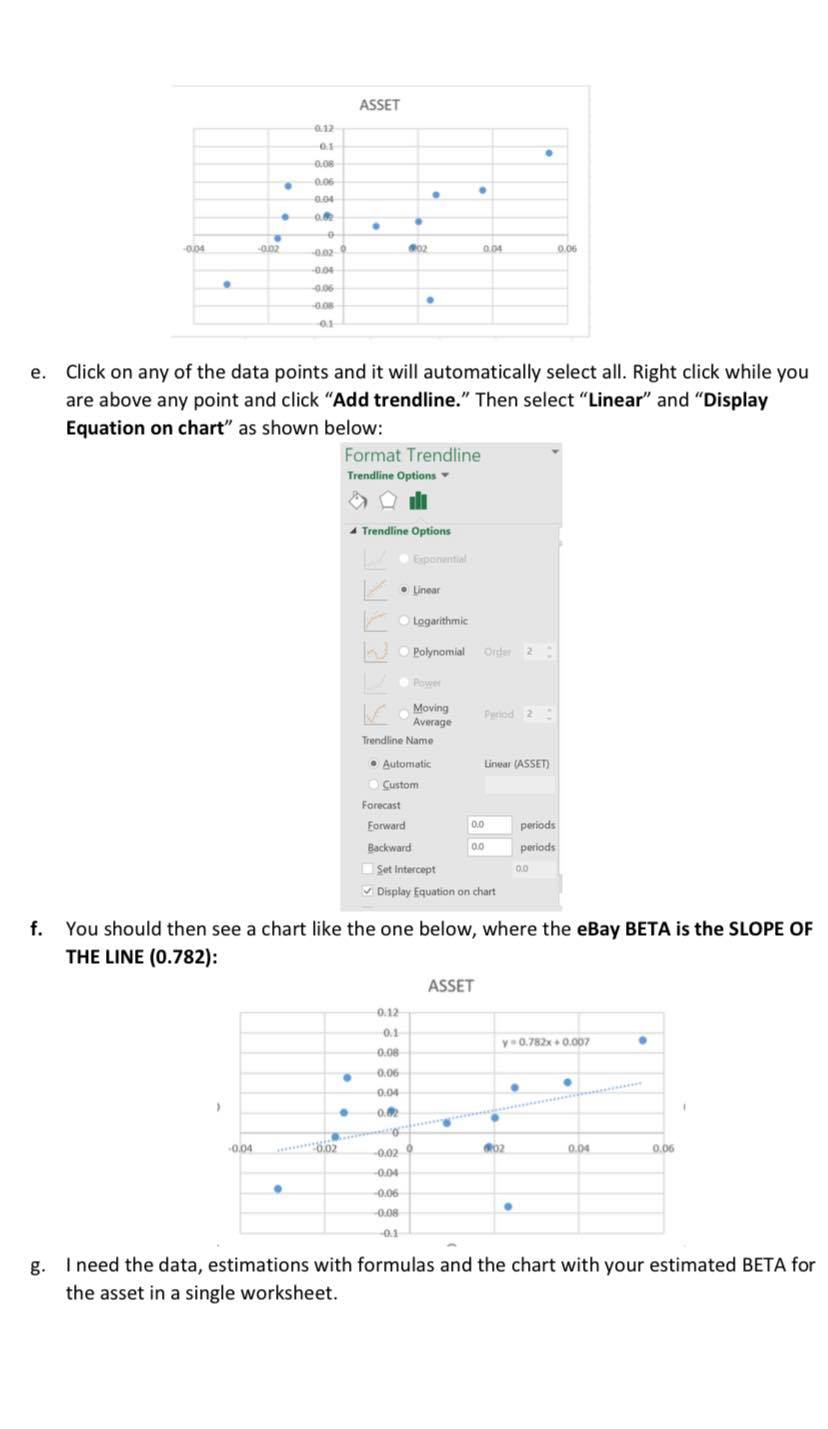
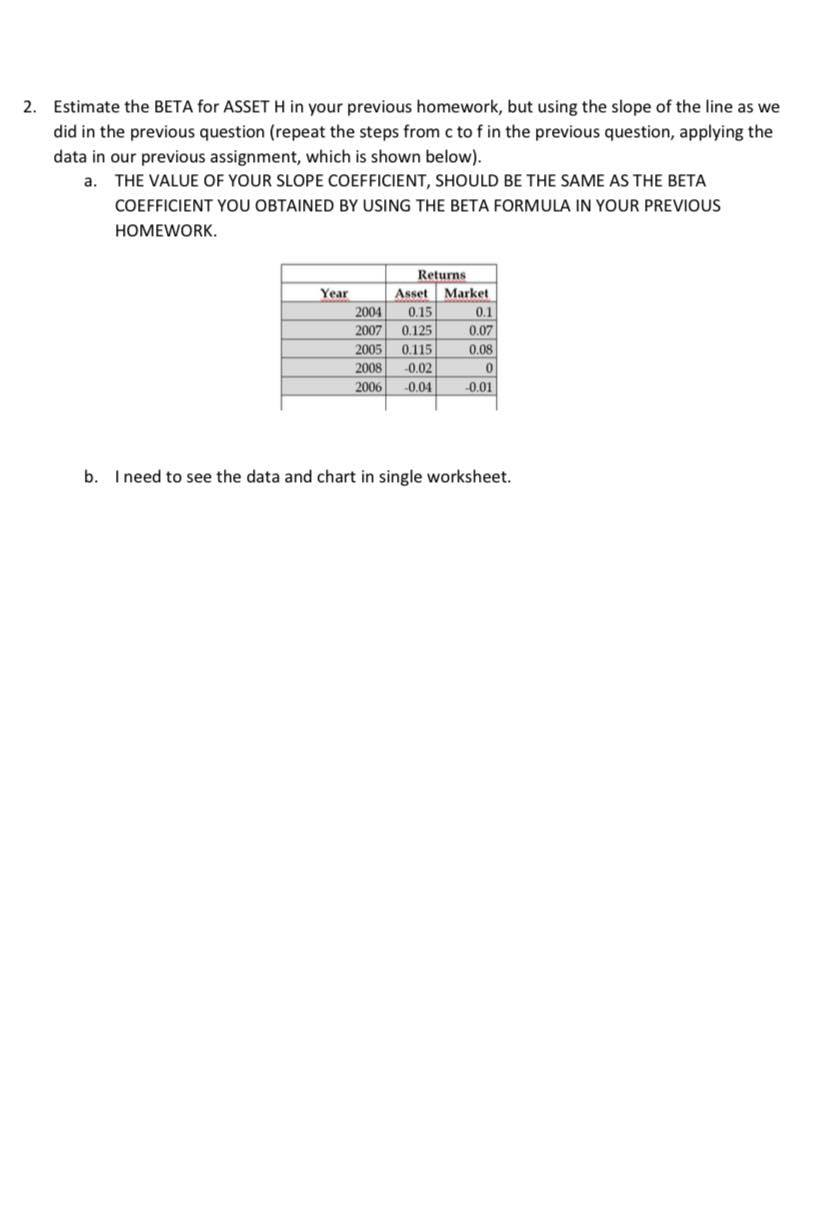
HOMEWORK 1. Use the data on Table 6.3 in the book (shown below). Table 6-3 Monthly Holding-Period Returns, eBay versus the S&P 500 Index, June 2014 through May 2015 (1 of 2) eBay Returns S&P 500 Index (%) Price S&P 500 Index Returns (%) eBay Price $50.73 50.06 Month and Year 2014 May June July August September October November December 52.83 55.50 56.63 52.50 54.88 56.12 -1.32% 5.53% 5.05% 2.04% -7.29% 4.53% 2.26% $1,924 1,960 1.931 2,003 1,972 2.018 2,068 2,059 1.87% -1.48% 3.73% -1.55% 2.33% 2.48% -0.44% S&P 500 P Index Returns (%) eBay S&P 500 Returns (%) Index Price eBay Price Month and Year 2015 January February March April May Average Monthly Retum Standard Deviation 53.00 57.91 57.68 58.26 59.15 -5.56% 9.26% -0.40% 1.01% 1.530 1.39% 1,995 2,105 2,068 2,086 2,128 -3.11% 5.51% -1.76% 0.87% 2-01 0.87% 4.65% 2.57% a. In Excel, estimate columns for I need to see the formulas whenever I click a cell. b. Estimate the Average monthly return and the Standard Deviation for each column. c. Order the two columns you estimated in (a), with S&P Index Returns (MARKET) in the first column and eBay Returns (ASSET) in the second as shown below. MARKET ASSET 0.018711 -0.0132072 -0.014796 0.0553336 0.037286 0.05053947 -0.015477 0.02036036 0.023327 0.0729295 0.024777 0.04533333 -0.004352 0.02259475 -0.031083 0.0555952 0.055138 0.09264151 -0.017577 -0.0039717 0.008704 0.01005548 0.020134 0.01527635 d. Select the data and insert a Scatter Chart. In the chart, you should see MARKET in the horizontal and ASSET in the vertical axis. You should see something like this: ASSET 0:12 01 0.08 0.06 0.04 . 0 -0.04 -0.02 doz 0.04 0.06 -0.04 . -0.06 . -0.00 01 e. Click on any of the data points and it will automatically select all. Right click while you are above any point and click "Add trendline." Then select "Linear" and "Display Equation on chart" as shown below: Format Trendline Trendline Options Trendline Options a Exponential Linear Logarithmic w Polynomial Order 2 be Powe Moving Average Trendline Name Automatic Linear (ASSET) Custom Forecast Forward 0.0 periods Backward 00 periods Set Intercept 00 Display Equation on chart f. You should then see a chart like the one below, where the eBay BETA is the SLOPE OF THE LINE (0.782): ASSET 0.12 0.1 y 0.782x+0.007 . 0.08 0.06 0.04 > 0.02 -0.04 6.02 802 0.04 0.06 -0.02 -0.04 . -0.06 -0.08 . -0.1 8 I need the data, estimations with formulas and the chart with your estimated BETA for the asset in a single worksheet. 2. Estimate the BETA for ASSET H in your previous homework, but using the slope of the line as we did in the previous question (repeat the steps from c to f in the previous question, applying the data in our previous assignment, which is shown below). a. THE VALUE OF YOUR SLOPE COEFFICIENT, SHOULD BE THE SAME AS THE BETA COEFFICIENT YOU OBTAINED BY USING THE BETA FORMULA IN YOUR PREVIOUS HOMEWORK. Year 2004 2007 2005 2008 2006 Returns Asset Market 0.15 0.1 0.125 0.07 0.115 0.08 0.02 0 -0.04 -0.01 b. I need to see the data and chart in single worksheet. HOMEWORK 1. Use the data on Table 6.3 in the book (shown below). Table 6-3 Monthly Holding-Period Returns, eBay versus the S&P 500 Index, June 2014 through May 2015 (1 of 2) eBay Returns S&P 500 Index (%) Price S&P 500 Index Returns (%) eBay Price $50.73 50.06 Month and Year 2014 May June July August September October November December 52.83 55.50 56.63 52.50 54.88 56.12 -1.32% 5.53% 5.05% 2.04% -7.29% 4.53% 2.26% $1,924 1,960 1.931 2,003 1,972 2.018 2,068 2,059 1.87% -1.48% 3.73% -1.55% 2.33% 2.48% -0.44% S&P 500 P Index Returns (%) eBay S&P 500 Returns (%) Index Price eBay Price Month and Year 2015 January February March April May Average Monthly Retum Standard Deviation 53.00 57.91 57.68 58.26 59.15 -5.56% 9.26% -0.40% 1.01% 1.530 1.39% 1,995 2,105 2,068 2,086 2,128 -3.11% 5.51% -1.76% 0.87% 2-01 0.87% 4.65% 2.57% a. In Excel, estimate columns for I need to see the formulas whenever I click a cell. b. Estimate the Average monthly return and the Standard Deviation for each column. c. Order the two columns you estimated in (a), with S&P Index Returns (MARKET) in the first column and eBay Returns (ASSET) in the second as shown below. MARKET ASSET 0.018711 -0.0132072 -0.014796 0.0553336 0.037286 0.05053947 -0.015477 0.02036036 0.023327 0.0729295 0.024777 0.04533333 -0.004352 0.02259475 -0.031083 0.0555952 0.055138 0.09264151 -0.017577 -0.0039717 0.008704 0.01005548 0.020134 0.01527635 d. Select the data and insert a Scatter Chart. In the chart, you should see MARKET in the horizontal and ASSET in the vertical axis. You should see something like this: ASSET 0:12 01 0.08 0.06 0.04 . 0 -0.04 -0.02 doz 0.04 0.06 -0.04 . -0.06 . -0.00 01 e. Click on any of the data points and it will automatically select all. Right click while you are above any point and click "Add trendline." Then select "Linear" and "Display Equation on chart" as shown below: Format Trendline Trendline Options Trendline Options a Exponential Linear Logarithmic w Polynomial Order 2 be Powe Moving Average Trendline Name Automatic Linear (ASSET) Custom Forecast Forward 0.0 periods Backward 00 periods Set Intercept 00 Display Equation on chart f. You should then see a chart like the one below, where the eBay BETA is the SLOPE OF THE LINE (0.782): ASSET 0.12 0.1 y 0.782x+0.007 . 0.08 0.06 0.04 > 0.02 -0.04 6.02 802 0.04 0.06 -0.02 -0.04 . -0.06 -0.08 . -0.1 8 I need the data, estimations with formulas and the chart with your estimated BETA for the asset in a single worksheet. 2. Estimate the BETA for ASSET H in your previous homework, but using the slope of the line as we did in the previous question (repeat the steps from c to f in the previous question, applying the data in our previous assignment, which is shown below). a. THE VALUE OF YOUR SLOPE COEFFICIENT, SHOULD BE THE SAME AS THE BETA COEFFICIENT YOU OBTAINED BY USING THE BETA FORMULA IN YOUR PREVIOUS HOMEWORK. Year 2004 2007 2005 2008 2006 Returns Asset Market 0.15 0.1 0.125 0.07 0.115 0.08 0.02 0 -0.04 -0.01 b. I need to see the data and chart in single worksheet
Step by Step Solution
There are 3 Steps involved in it

Get step-by-step solutions from verified subject matter experts