

Question: Mini Case This Mini Case is available in My Financelab Note: Although not absolutely necessary, you are advised to use a computer spread sheet to
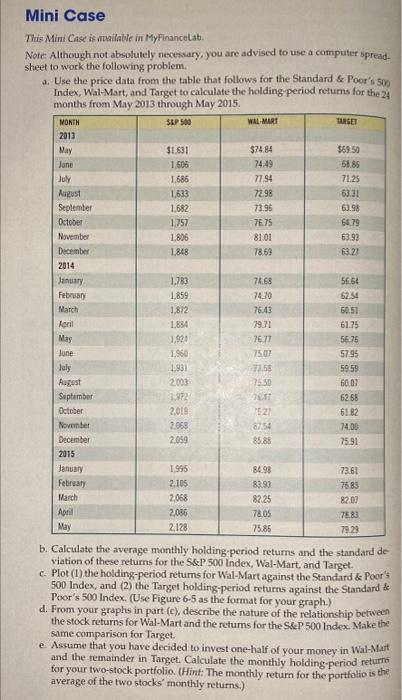
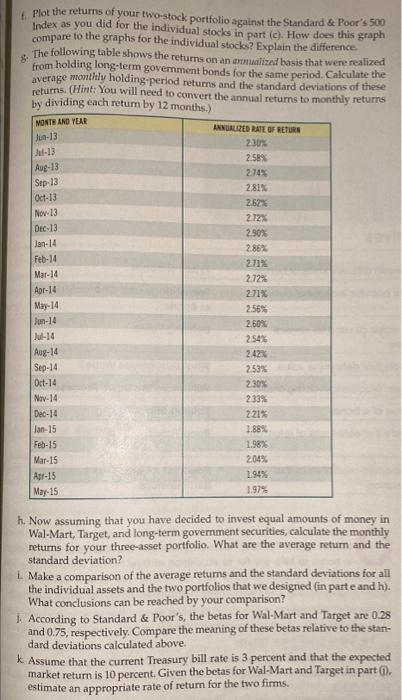
Mini Case This Mini Case is available in My Financelab Note: Although not absolutely necessary, you are advised to use a computer spread sheet to work the following problem. a. Use the price data from the table that follows for the Standard & Poor's 56 Index, Wal-Mart, and Target to calculate the holding period retums for the 24 months from May 2013 through May 2015. MONTH SLP 500 WALMART TARSE 2013 Nay $1631 $74 84 $69.50 1506 7449 6885 July 1,686 77.94 71.25 August 1,633 72.98 63.31 September 1.682 73.95 63.58 October 1,752 7E75 68.79 November 1.806 81.01 63.93 December 1.848 78.69 63.22 2014 January 1.783 74.68 56.54 February 1.859 74.70 62.54 March 1,872 76:43 60.51 Ronil 1.834 79.71 61.75 May 1,921 76.77 56.76 lone 1960 7507 July 1931 71.55 5959 August 2003 7530 6007 September 2.972 11 6268 October 2015 1523 61 82 November 2.060 87.54 74.00 December 2.059 85.88 75,91 2015 January 1995 84.98 73.61 February 2.105 89.93 7583 March 2,068 82.25 8200 April 2,086 78.05 7580 May 2,128 75.86 7929 5795 b. Calculate the average monthly holding period returns and the standard de viation of these returns for the S&P 500 Index, Wal-Mart, and Target c. Plot (1) the holding-period retums for Wal-Mart against the Standard & Poor 500 Index, and (2) the Target holding-period returns against the Standard & Poor's 500 Index. (Use Figure 6-5 as the format for your graph.) d. From your graphs in part (e), describe the nature of the relationship between the stock returns for Wal-Mart and the returns for the S&P 500 Index. Make the same comparison for Target. e Assume that you have decided to invest one-half of your money in Wal-Mart and the remainder in Target Calculate the monthly holding period return for your two-stock portfolio. (Hint: The monthly return for the portfolio is the average of the two stocks' monthly returns.) MONTH AND YEAR J-13 Jul-13 Aug-13 Sep 13 Oct-13 Nov 13 . Plot the returns of your two-stock portfolio against the Standard & Poor's son Index as you did for the individual stocks in part (c). How does this graph compare to the graphs for the individual stocks? Explain the difference. The following table shows the returns on an amalized basis that were realized from holding long-term government bonds for the same period. Calculate the average monthly holding period returns and the standard deviations of these retums. (Hint: You will need to convert the annual returns to monthly returns by dividing each retum by 12 months.) ANNUALIZED RATE OF RETURN 2.30% 2589 2.74% 2815 2623 2.12% Dec-13 2 90% Jan-14 2.86% Feb-14 271% Mat-14 2.72% Apr-14 2.71% May-14 2.56% Som-14 2.60% Jul-14 2.54% Aug-14 2.42% Sep-14 2.53% Oct-14 2.30% Nov-14 233% Dec-14 221% Jan-15 1.88% Feb-15 1.98% Mar 15 204% Apr-15 194% May 15 1.97% h. Now assuming that you have decided to invest equal amounts of money in Wal-Mart, Target, and long-term government securities, calculate the monthly returns for your three-asset portfolio. What are the average return and the standard deviation? 1. Make a comparison of the average returns and the standard deviations for all the individual assets and the two portfolios that we designed (in parte and h). What conclusions can be reached by your comparison? 1. According to Standard & Poor's, the betas for Wal-Mart and Target are 0.28 and 0.75, respectively. Compare the meaning of these betas relative to the stan- dard deviations calculated above k Assume that the current Treasury bill rate is 3 percent and that the expected market return is 10 percent. Given the betas for Wal-Mart and Target in parti. estimate an appropriate rate of return for the two firms. Mini Case This Mini Case is available in My Financelab Note: Although not absolutely necessary, you are advised to use a computer spread sheet to work the following problem. a. Use the price data from the table that follows for the Standard & Poor's 56 Index, Wal-Mart, and Target to calculate the holding period retums for the 24 months from May 2013 through May 2015. MONTH SLP 500 WALMART TARSE 2013 Nay $1631 $74 84 $69.50 1506 7449 6885 July 1,686 77.94 71.25 August 1,633 72.98 63.31 September 1.682 73.95 63.58 October 1,752 7E75 68.79 November 1.806 81.01 63.93 December 1.848 78.69 63.22 2014 January 1.783 74.68 56.54 February 1.859 74.70 62.54 March 1,872 76:43 60.51 Ronil 1.834 79.71 61.75 May 1,921 76.77 56.76 lone 1960 7507 July 1931 71.55 5959 August 2003 7530 6007 September 2.972 11 6268 October 2015 1523 61 82 November 2.060 87.54 74.00 December 2.059 85.88 75,91 2015 January 1995 84.98 73.61 February 2.105 89.93 7583 March 2,068 82.25 8200 April 2,086 78.05 7580 May 2,128 75.86 7929 5795 b. Calculate the average monthly holding period returns and the standard de viation of these returns for the S&P 500 Index, Wal-Mart, and Target c. Plot (1) the holding-period retums for Wal-Mart against the Standard & Poor 500 Index, and (2) the Target holding-period returns against the Standard & Poor's 500 Index. (Use Figure 6-5 as the format for your graph.) d. From your graphs in part (e), describe the nature of the relationship between the stock returns for Wal-Mart and the returns for the S&P 500 Index. Make the same comparison for Target. e Assume that you have decided to invest one-half of your money in Wal-Mart and the remainder in Target Calculate the monthly holding period return for your two-stock portfolio. (Hint: The monthly return for the portfolio is the average of the two stocks' monthly returns.) MONTH AND YEAR J-13 Jul-13 Aug-13 Sep 13 Oct-13 Nov 13 . Plot the returns of your two-stock portfolio against the Standard & Poor's son Index as you did for the individual stocks in part (c). How does this graph compare to the graphs for the individual stocks? Explain the difference. The following table shows the returns on an amalized basis that were realized from holding long-term government bonds for the same period. Calculate the average monthly holding period returns and the standard deviations of these retums. (Hint: You will need to convert the annual returns to monthly returns by dividing each retum by 12 months.) ANNUALIZED RATE OF RETURN 2.30% 2589 2.74% 2815 2623 2.12% Dec-13 2 90% Jan-14 2.86% Feb-14 271% Mat-14 2.72% Apr-14 2.71% May-14 2.56% Som-14 2.60% Jul-14 2.54% Aug-14 2.42% Sep-14 2.53% Oct-14 2.30% Nov-14 233% Dec-14 221% Jan-15 1.88% Feb-15 1.98% Mar 15 204% Apr-15 194% May 15 1.97% h. Now assuming that you have decided to invest equal amounts of money in Wal-Mart, Target, and long-term government securities, calculate the monthly returns for your three-asset portfolio. What are the average return and the standard deviation? 1. Make a comparison of the average returns and the standard deviations for all the individual assets and the two portfolios that we designed (in parte and h). What conclusions can be reached by your comparison? 1. According to Standard & Poor's, the betas for Wal-Mart and Target are 0.28 and 0.75, respectively. Compare the meaning of these betas relative to the stan- dard deviations calculated above k Assume that the current Treasury bill rate is 3 percent and that the expected market return is 10 percent. Given the betas for Wal-Mart and Target in parti. estimate an appropriate rate of return for the two firms
Step by Step Solution
There are 3 Steps involved in it

Get step-by-step solutions from verified subject matter experts