

Question: Homework #3 The chart below gives the data necessary to make a Keynesian cross diagram. Assume that the tax rate is 0.4 of national income,

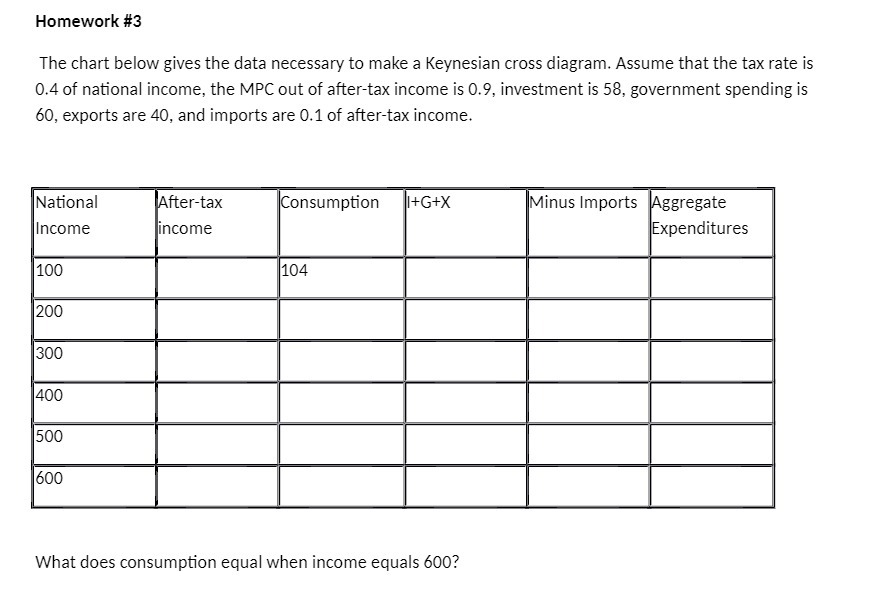
Homework #3 The chart below gives the data necessary to make a Keynesian cross diagram. Assume that the tax rate is 0.4 of national income, the MPC out of after-tax income is 0.9, investment is 58, government spending is 60, exports are 40, and imports are 0.1 of after-tax income. National After-tax Consumption I+G+X Minus Imports Aggregate Income income Expenditures 100 104 200 300 400 500 600 What does consumption equal when income equals 600
Step by Step Solution
There are 3 Steps involved in it
1 Expert Approved Answer
Step: 1 Unlock

Question Has Been Solved by an Expert!
Get step-by-step solutions from verified subject matter experts
Step: 2 Unlock
Step: 3 Unlock