

Question: The chart below gives the data necessary to make a Keynesian cross diagram. Assume that the tax rate is 0 . 4 of national income,
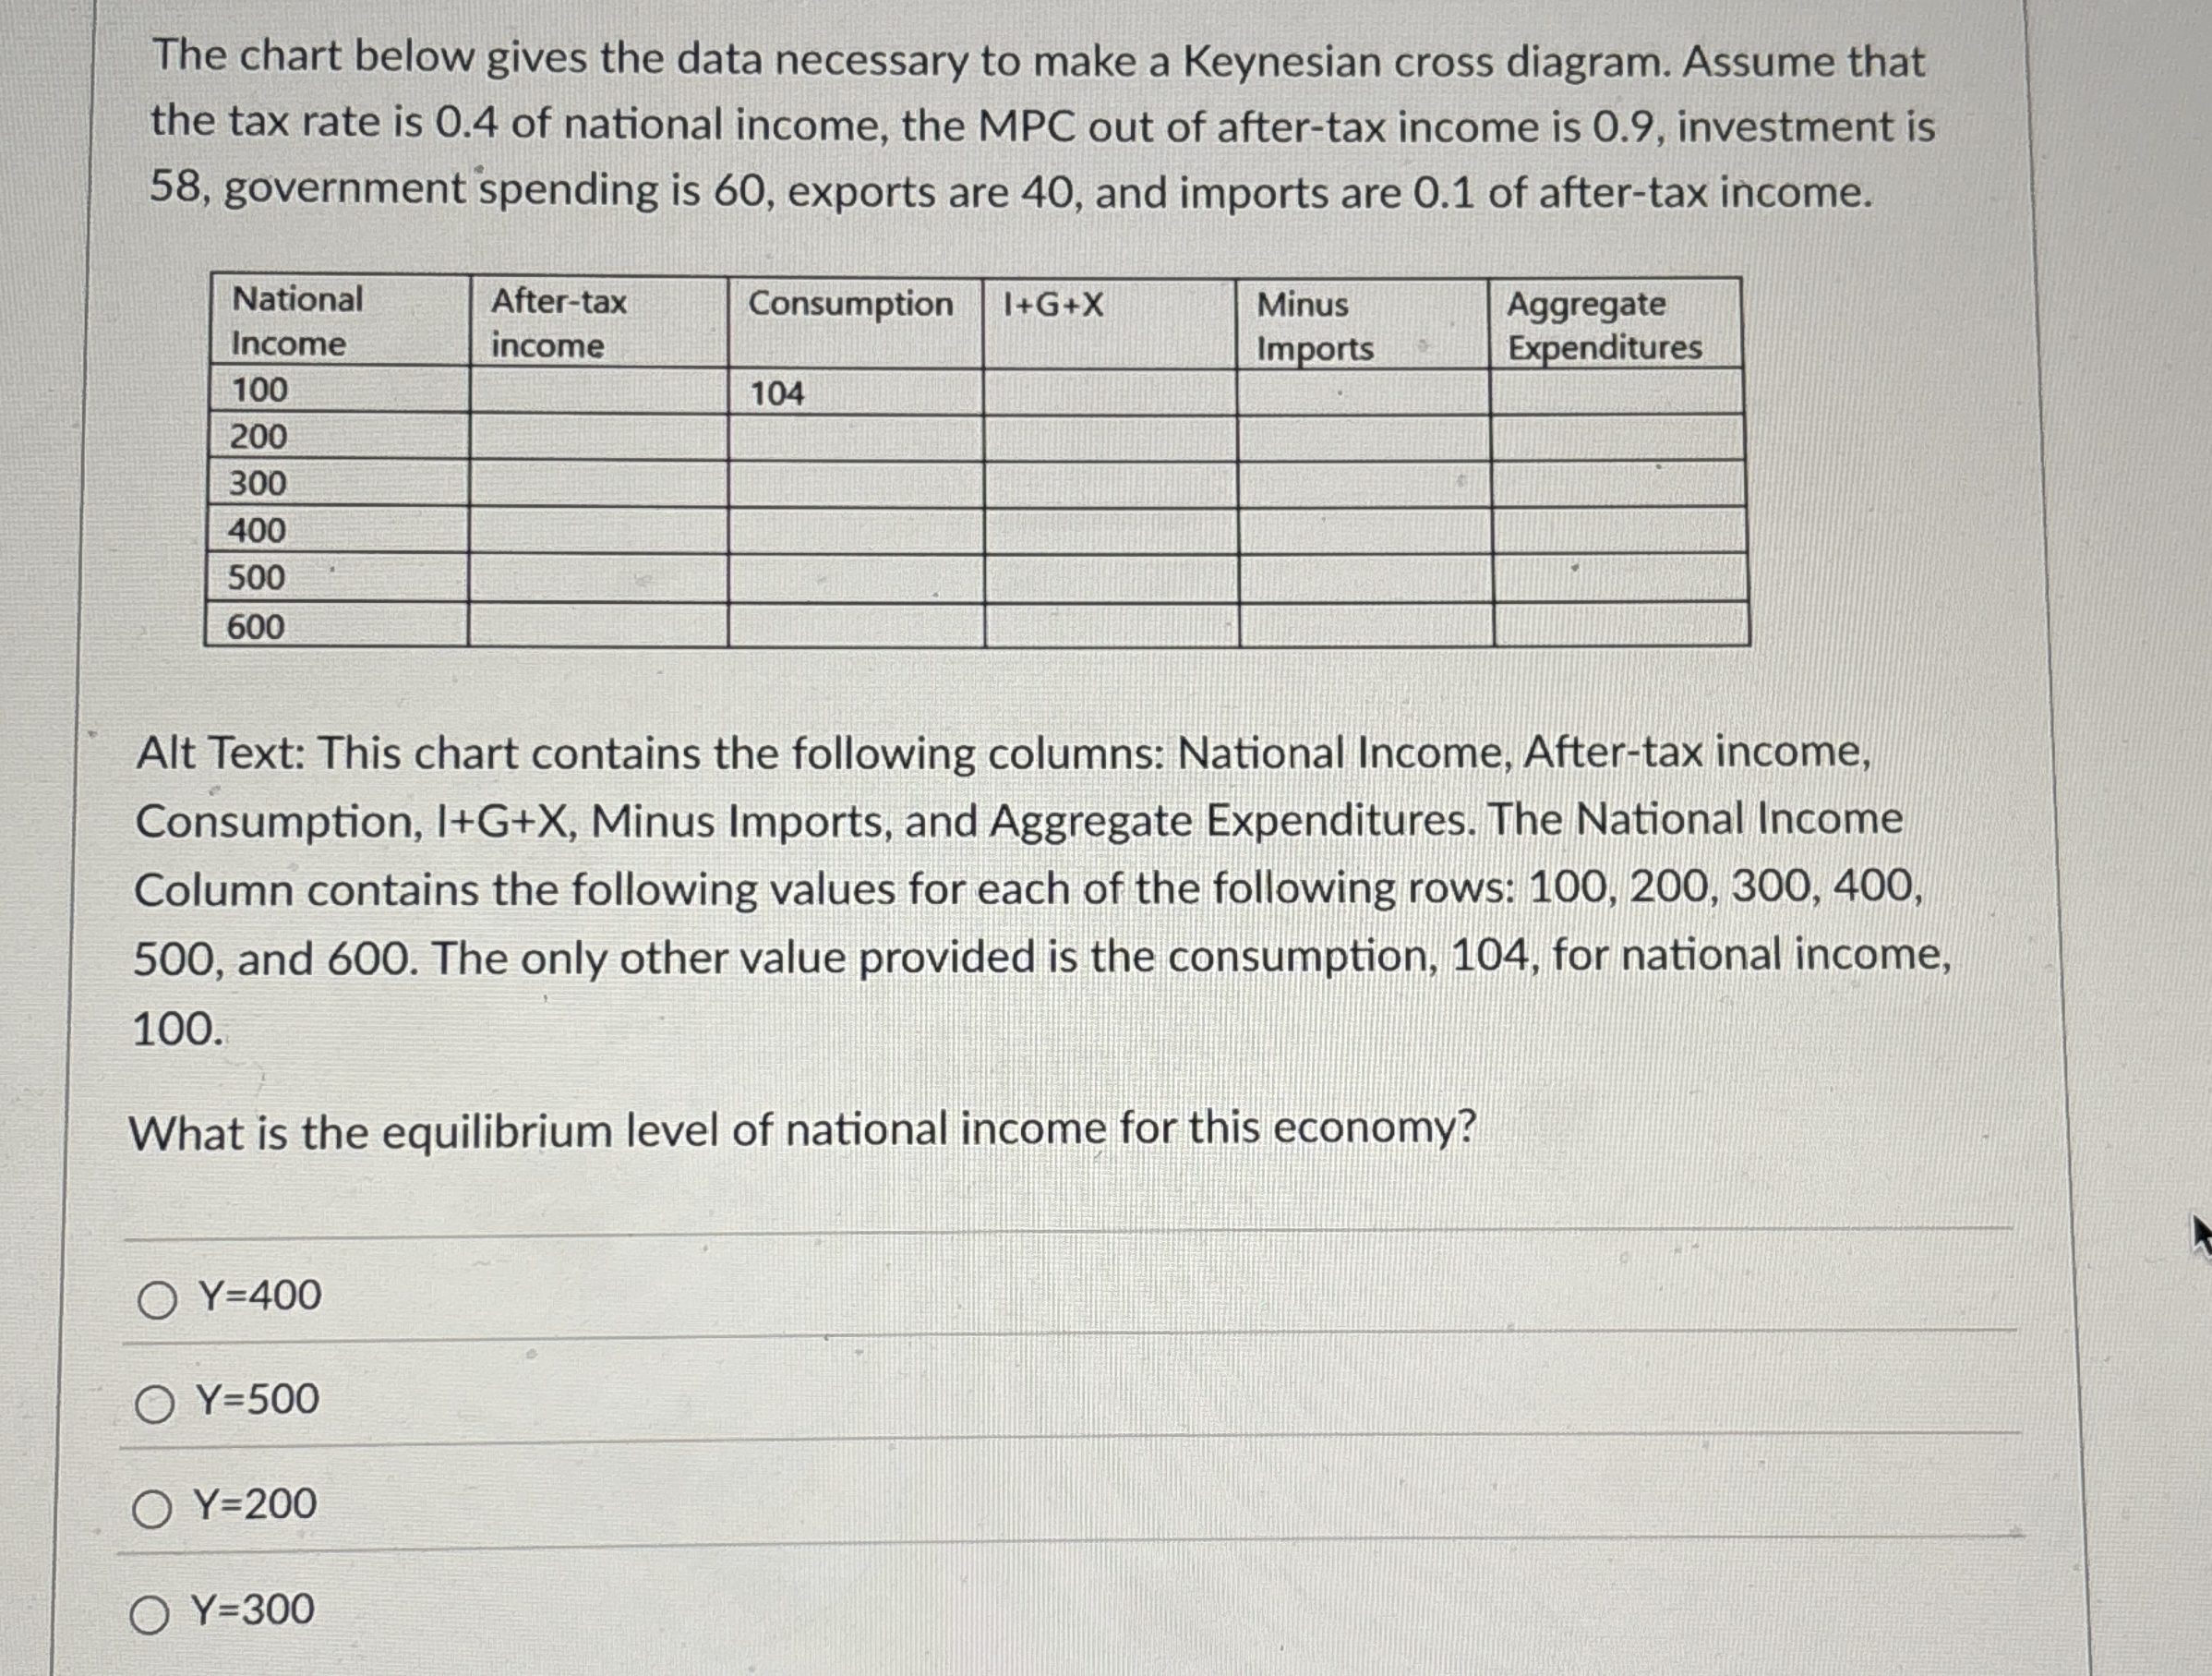
The chart below gives the data necessary to make a Keynesian cross diagram. Assume that the tax rate is of national income, the MPC out of aftertax income is investment is government spending is exports are and imports are of aftertax income.
tabletableNationalIncometableAftertaxincomeConsumption,tableMinusImportstableAggregateExpenditures
Alt Text: This chart contains the following columns: National Income, Aftertax income, Consumption, IGX Minus Imports, and Aggregate Expenditures. The National Income Column contains the following values for each of the following rows: and The only other value provided is the consumption, for national income,
What is the equilibrium level of national income for this economy?
Step by Step Solution
There are 3 Steps involved in it
1 Expert Approved Answer
Step: 1 Unlock

Question Has Been Solved by an Expert!
Get step-by-step solutions from verified subject matter experts
Step: 2 Unlock
Step: 3 Unlock