

Question: Homework 3.2: Presenting Data Graphically Score: 20.78/40 10/18 answered Progress saved Done CEJ WIEC' @ Question 16 v & 0/2pts O3 299 O Details During
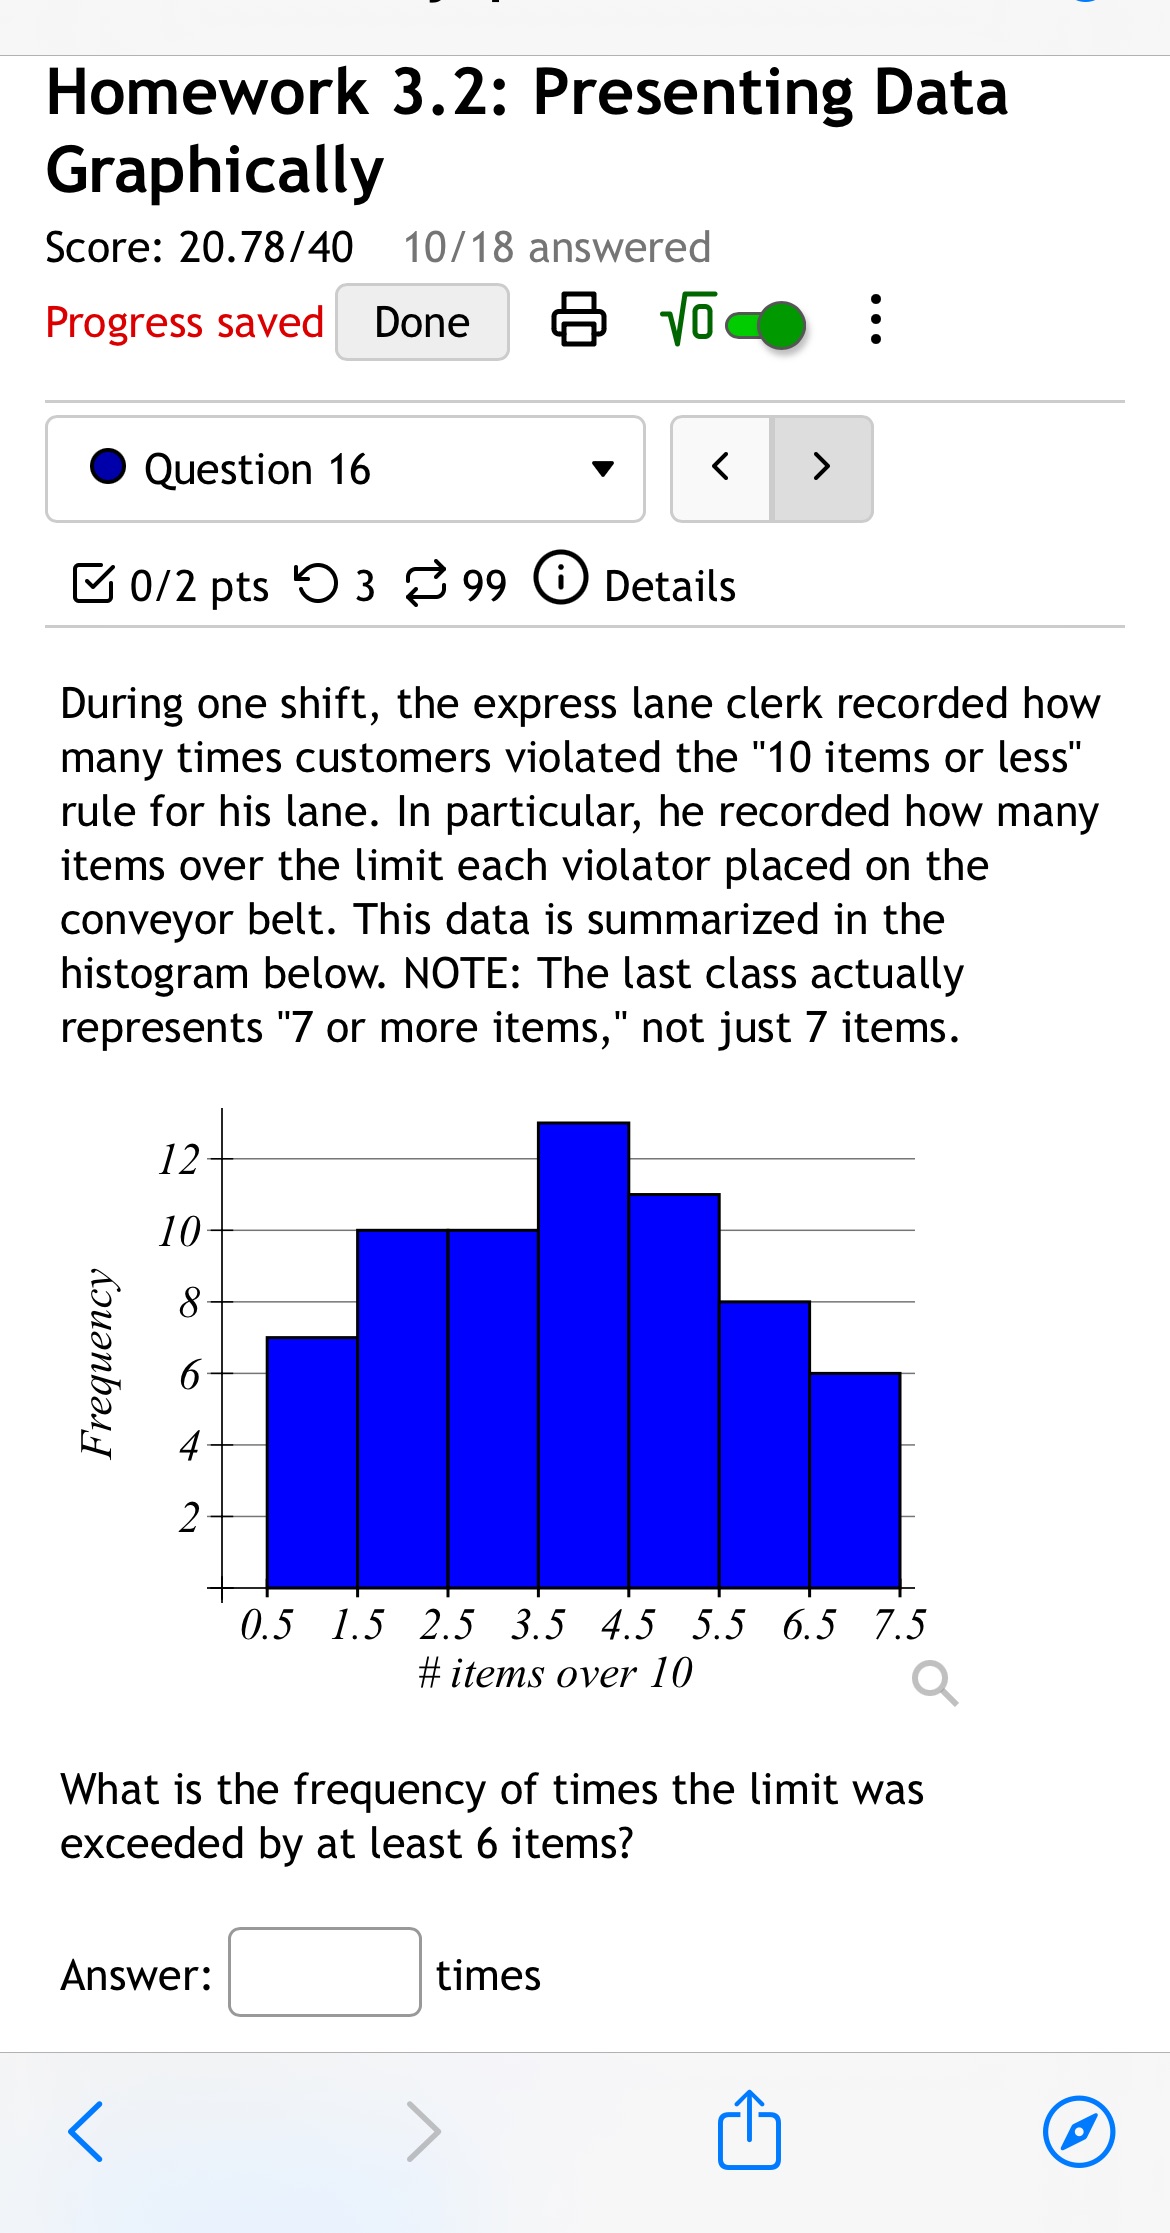
Homework 3.2: Presenting Data Graphically Score: 20.78/40 10/18 answered Progress saved Done CEJ WIEC' @ Question 16 v & 0/2pts O3 299 O Details During one shift, the express lane clerk recorded how many times customers violated the "10 items or less\" rule for his lane. In particular, he recorded how many items over the limit each violator placed on the conveyor belt. This data is summarized in the histogram below. NOTE: The last class actually represents "7 or more items,\" not just 7 items. Frequency 05 1.5 2.5 35 45 55 65 7.5 #items over 10 What is the frequency of times the limit was exceeded by at least 6 items? Answer: times
Step by Step Solution
There are 3 Steps involved in it
1 Expert Approved Answer
Step: 1 Unlock

Question Has Been Solved by an Expert!
Get step-by-step solutions from verified subject matter experts
Step: 2 Unlock
Step: 3 Unlock