

Question: Homework 3.2: Presenting Data Graphically Score: 20.78/40 14/18 answered Progress saved Done (EJ W[EC' @ Question 7 v & 0/2pts O3 298 O Details The
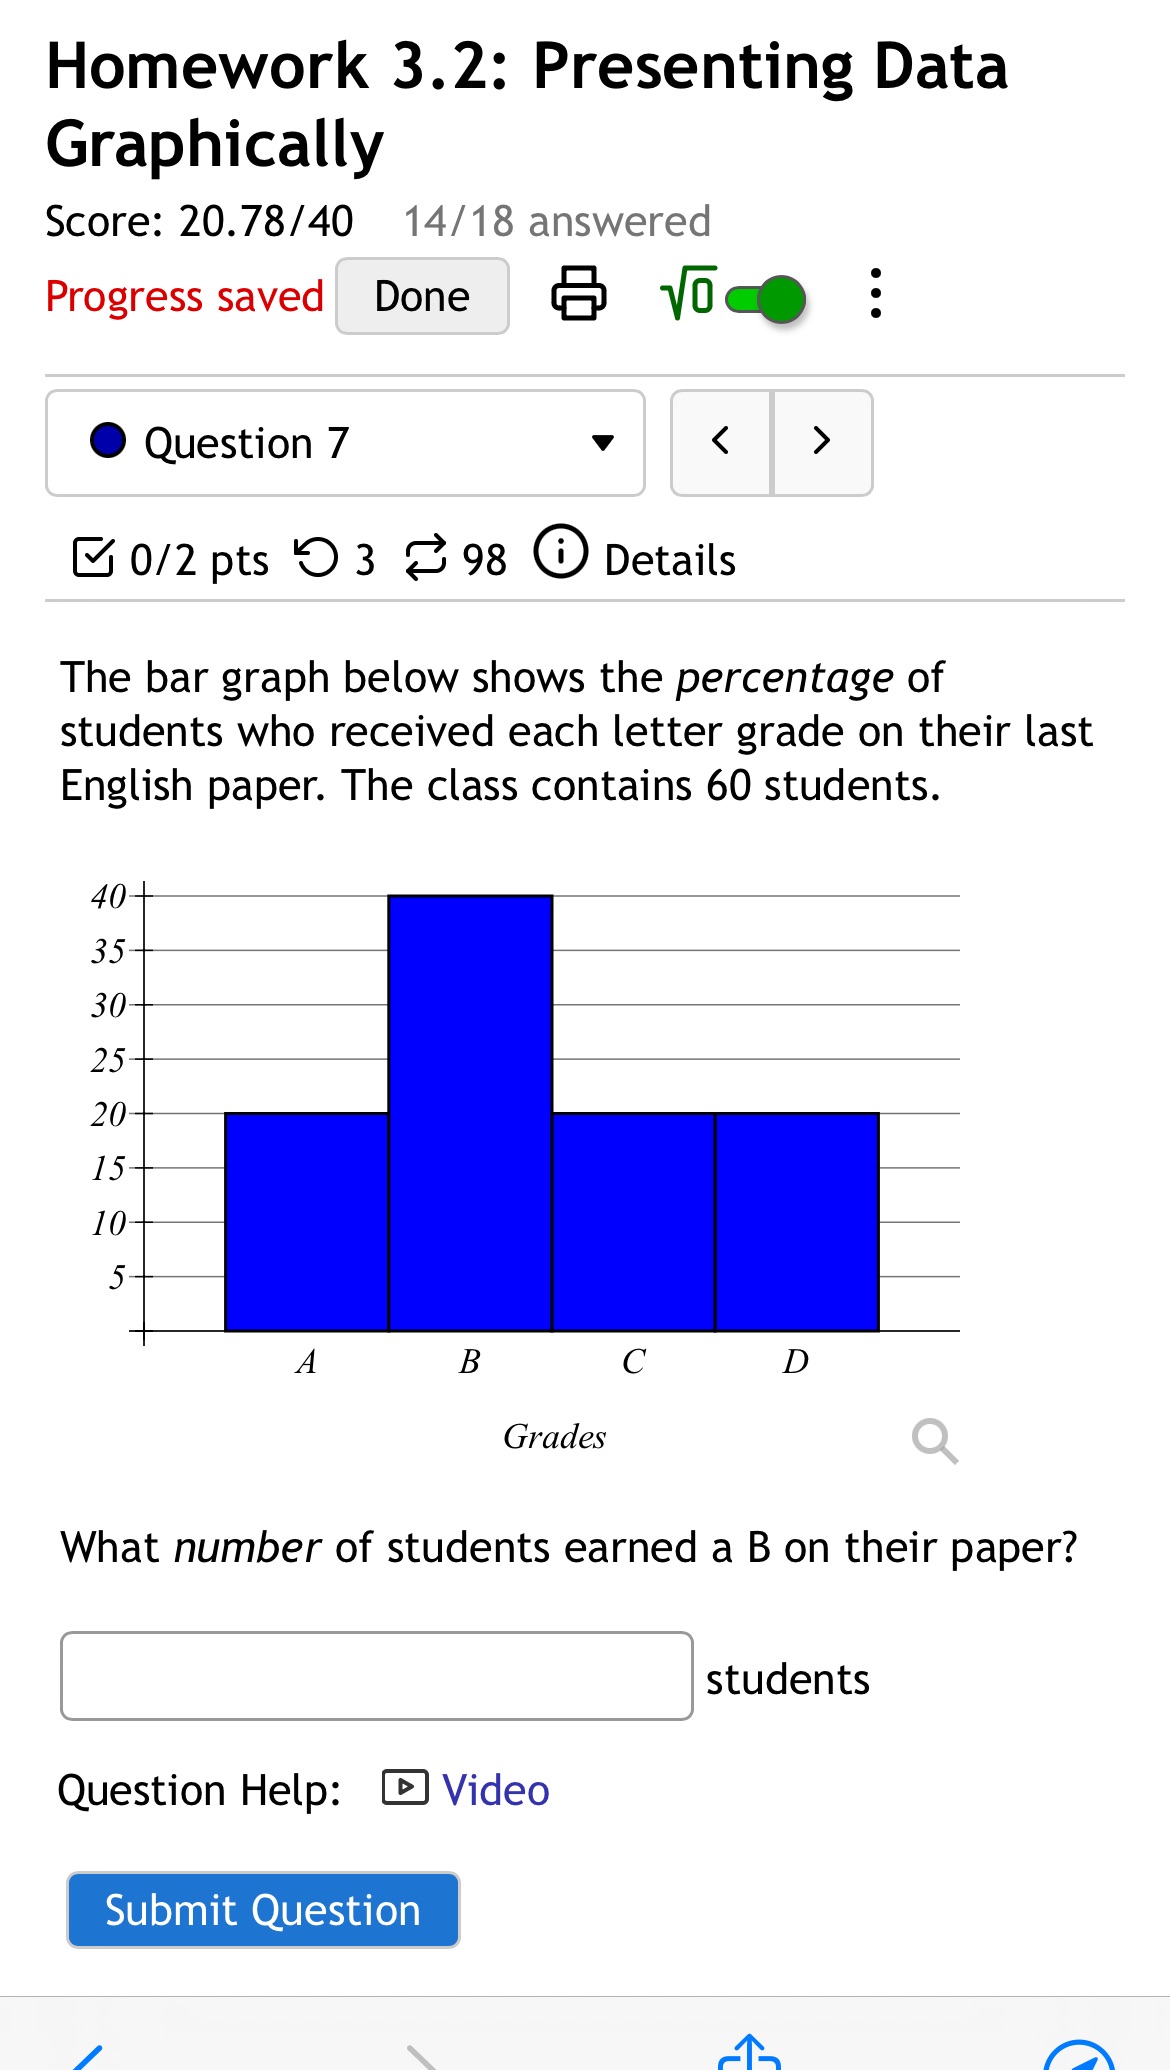
Homework 3.2: Presenting Data Graphically Score: 20.78/40 14/18 answered Progress saved Done (EJ W[EC' @ Question 7 v & 0/2pts O3 298 O Details The bar graph below shows the percentage of students who received each letter grade on their last English paper. The class contains 60 students. 40 35 30 20 20 15 10 5 A B C D Grades What number of students earned a B on their paper? students Question Help: [] Video Submit
Step by Step Solution
There are 3 Steps involved in it
1 Expert Approved Answer
Step: 1 Unlock

Question Has Been Solved by an Expert!
Get step-by-step solutions from verified subject matter experts
Step: 2 Unlock
Step: 3 Unlock