

Question: Homework 6.1 Question 7 Set up a definite integral thal represents the area bounded by the graphs of the indicated equations over the given interval.

Homework 6.1
Question 7
![= r2 and area 7: l2]. y= -/169-x2;y=0;05x513 Set up a denite](https://s3.amazonaws.com/si.experts.images/answers/2024/06/66748c19d0936_07366748c19af345.jpg)


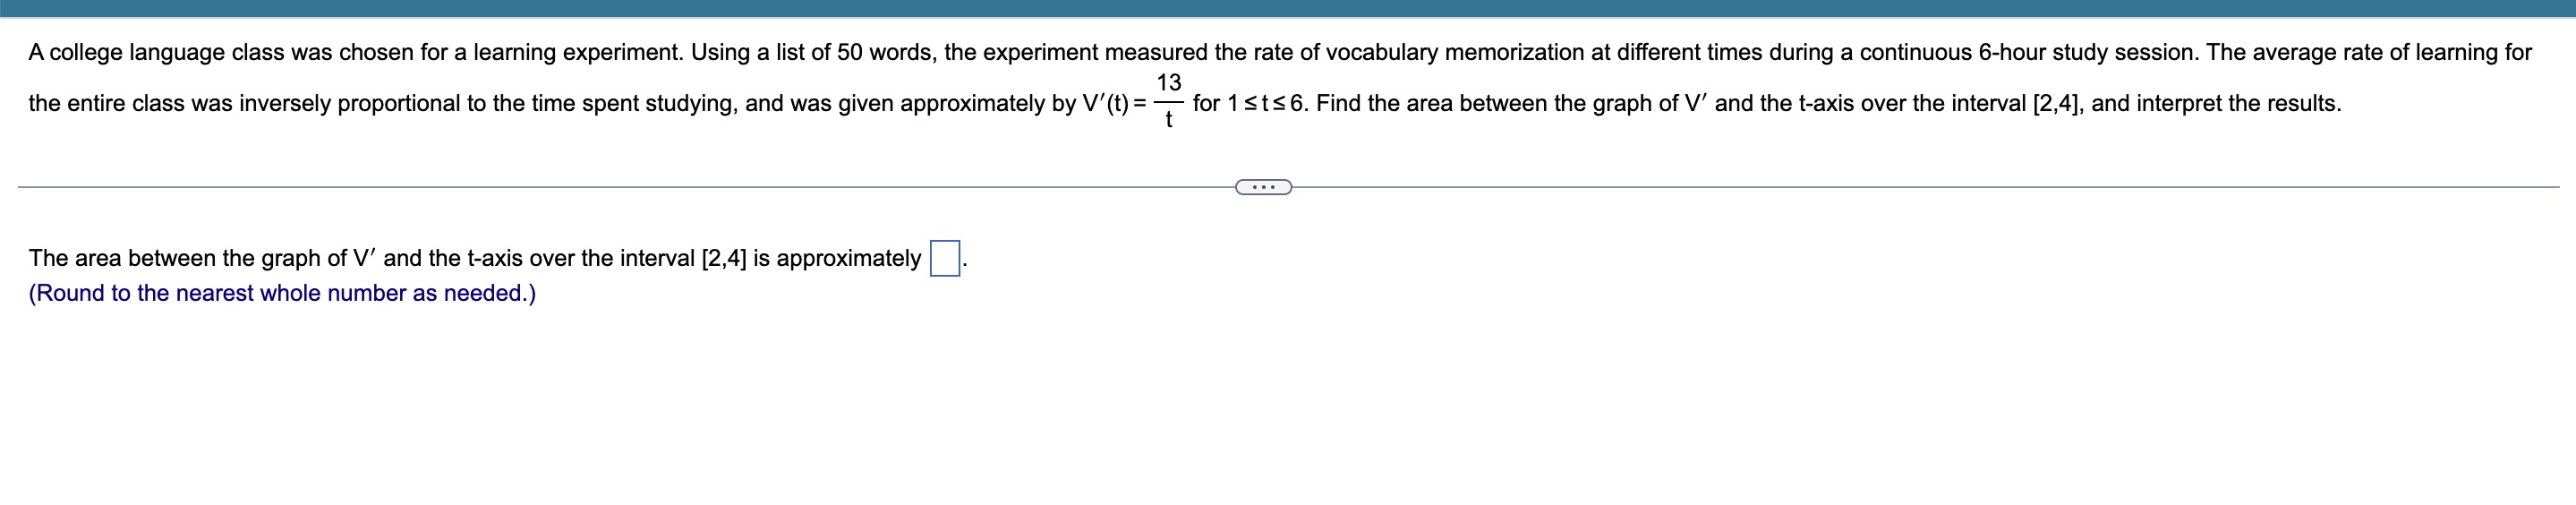
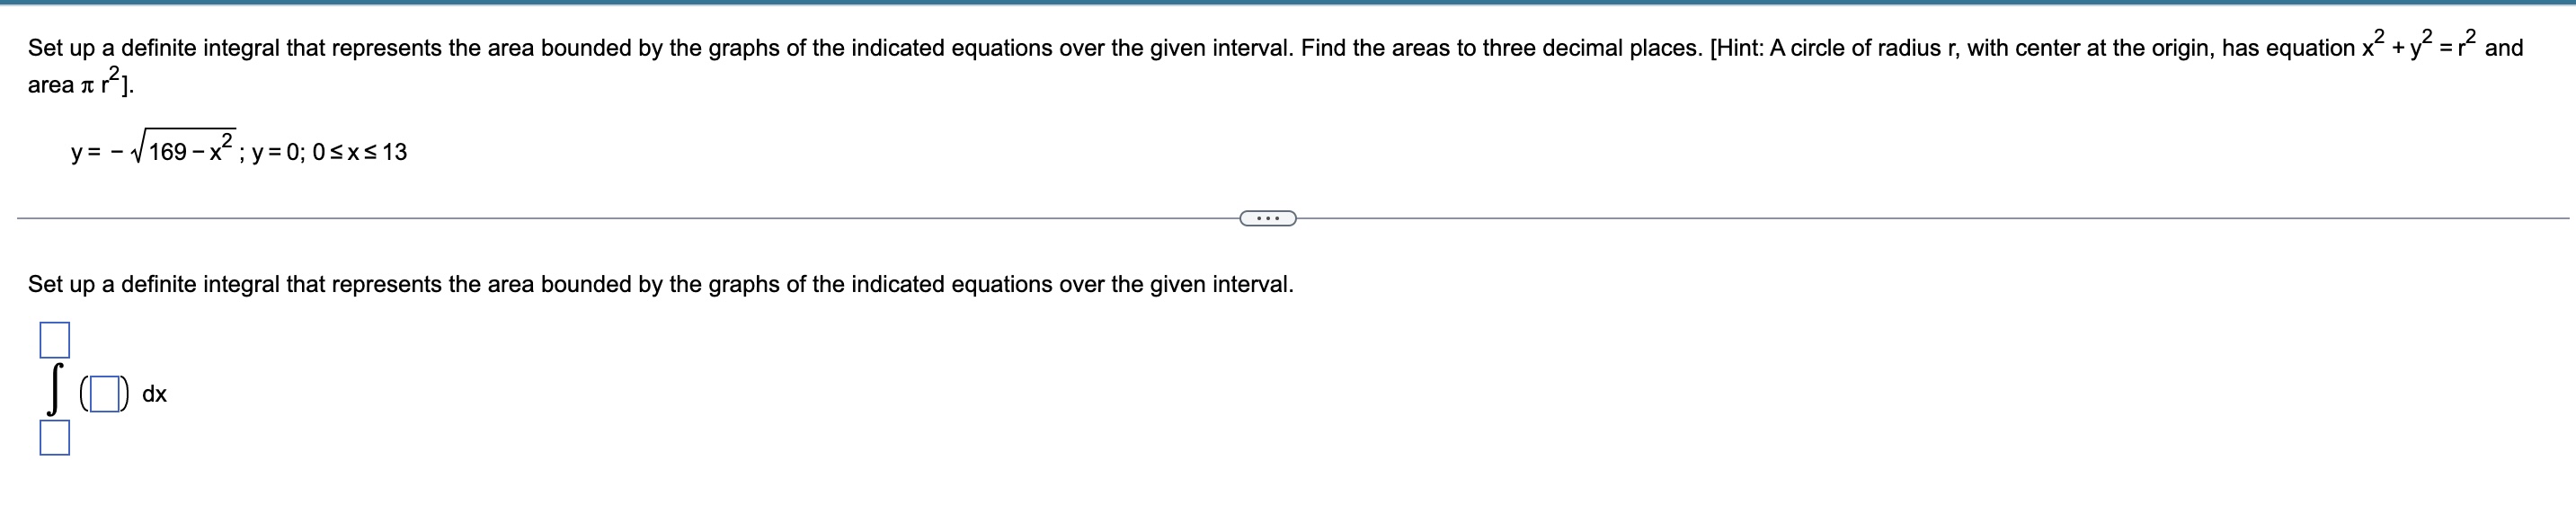
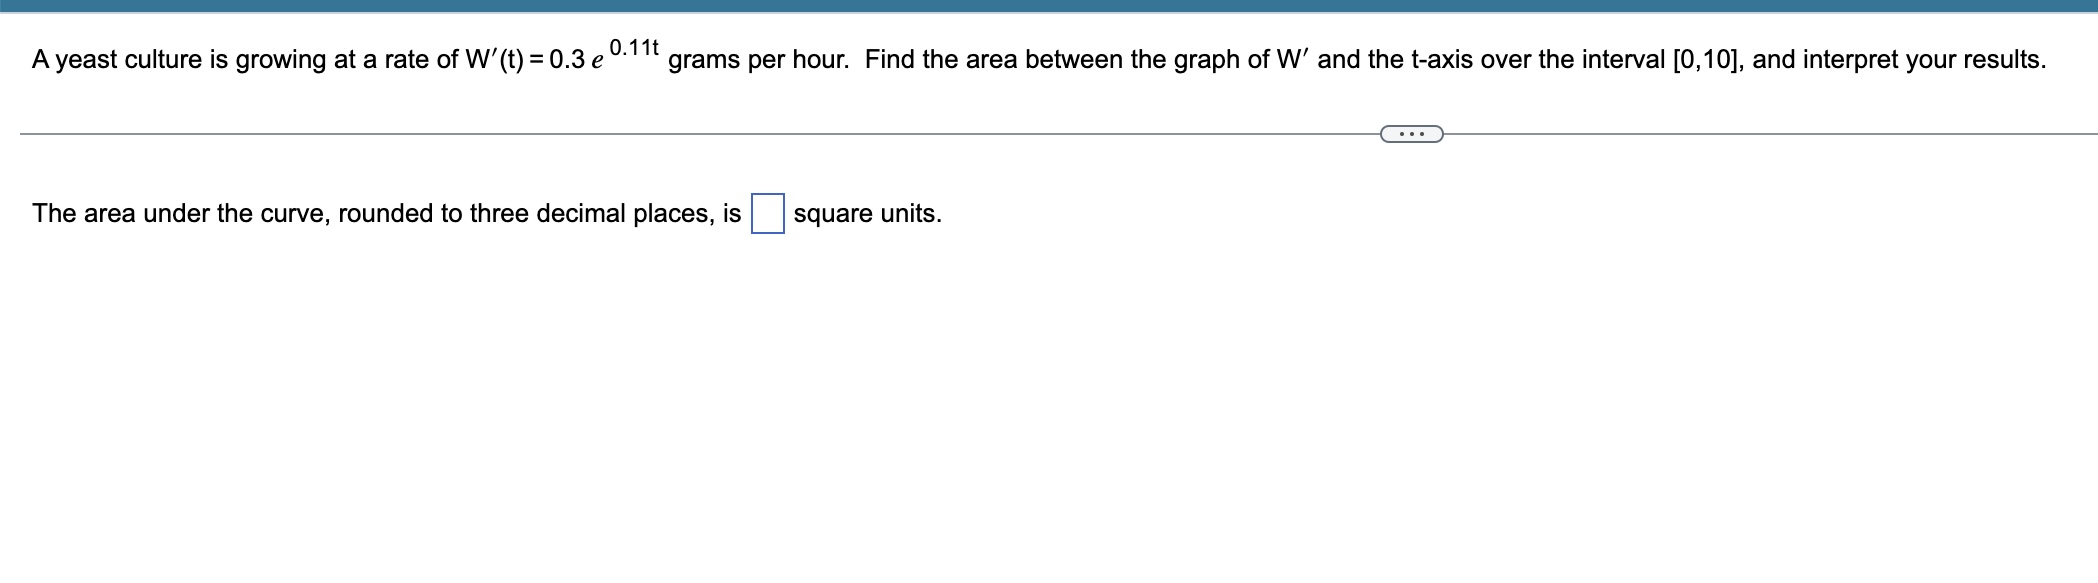
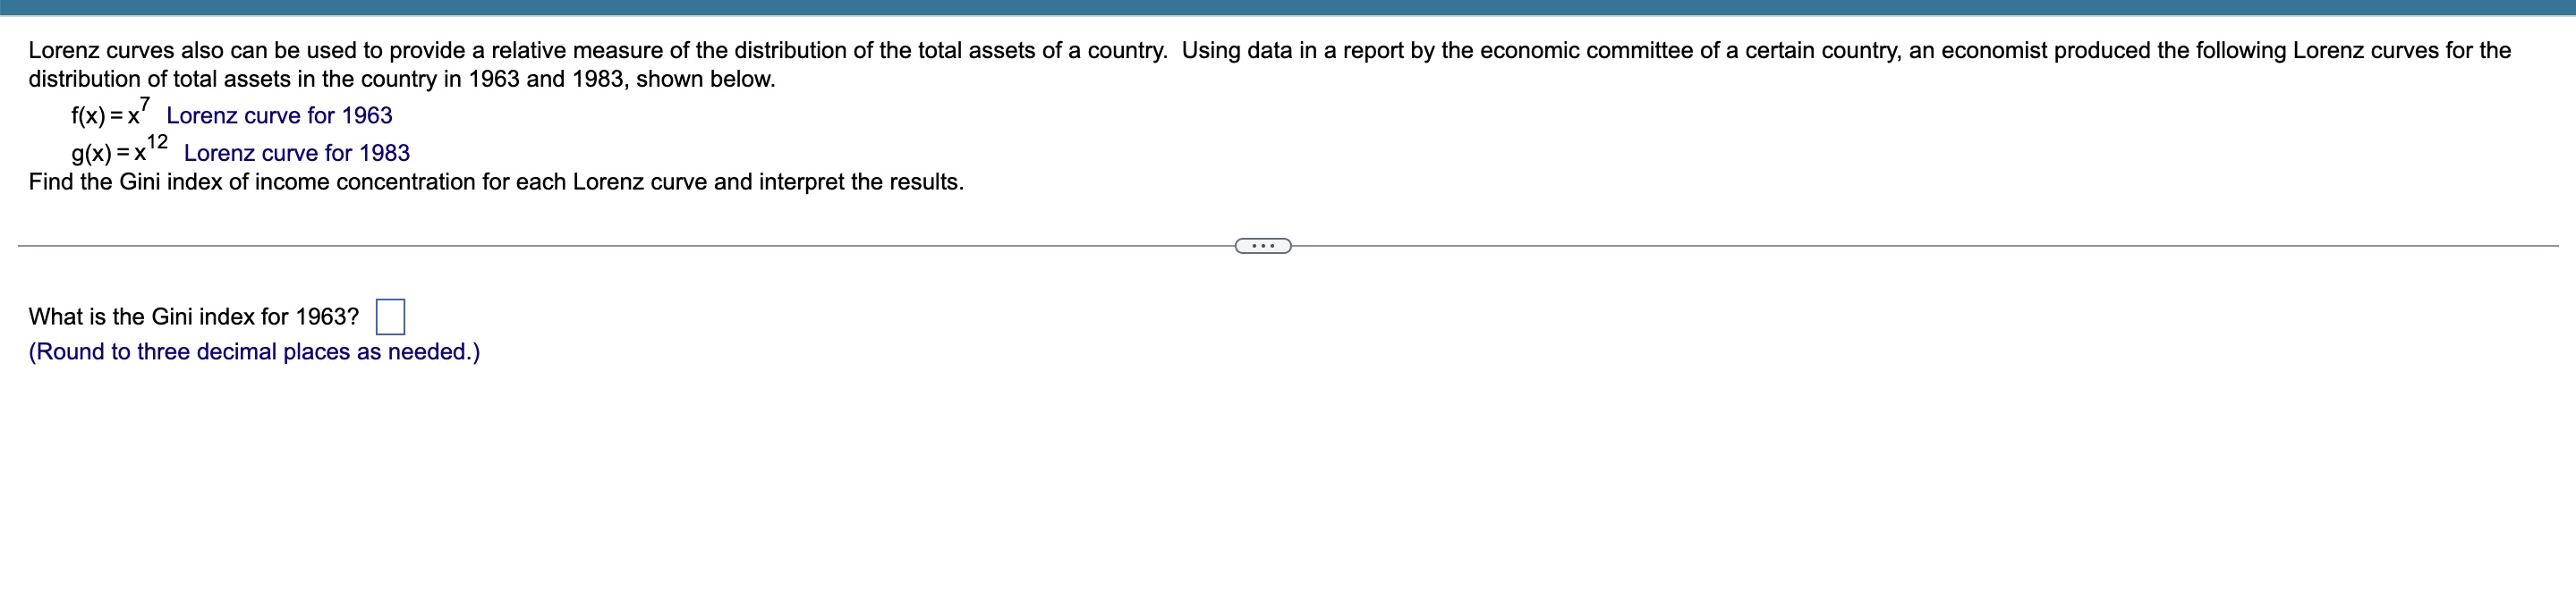
Set up a definite integral thal represents the area bounded by the graphs of the indicated equations over the given interval. Find the areas to three decimal places. [Hint: A circle of radius r, with center at the origin, has equation x2 + y2 = r2 and area 7: l2]. y= -/169-x2;y=0;05x513 Set up a denite integral that represents the area bounded by the graphs of the indicated equations over the given interval. J( dx 0.11t Ayeast culture is growing at a rate of W' (t) = 0.3 e grams per hour. Find the area between the graph of W' and the t-axis over the interval [0,10], and interpret your results. The area under the curve, rounded to three decimal places, is :l square units. Lorenz cuwes also can be used to provide a relative measure of the distribution of the total assets of a country. Using data in a report by the economic committee of a certain country, an economist produced the following Lorenz cunles for the distribution of total assets in the country in 1963 and 1988, shown below. f(x) = x7 Lorenz curve for 1963 9(X) =X Lorenz curve for 1983 Find the Gini index of income concentration for each Lorenz curve and interpret the results. What is the Gini index for 1963? (Round to three decimal places as needed.) A college language class was chosen for a learning experiment. Using a list of 50 words, the experiment measured the rate of vocabulary memorization at different times during a continuous 6hour study session. The average ram of learning for 13 the entire class was inversely proportional to the time spent studying, and was given approximately by V'(t) = T tor 1 St S 6. Find the area between the graph ot V' and the t-axis over the interval [2,4], and interpret the results. The area between the graph ofV' and the t-axis over the interval [2,4] is approximately (Round to the nearest whole number as needed.)
Step by Step Solution
There are 3 Steps involved in it

Get step-by-step solutions from verified subject matter experts