

Question: Question 1 A college language class was chosen for a learning experiment. Using a list of 50 words, the experiment measured the rate of vocabulary
Question 1
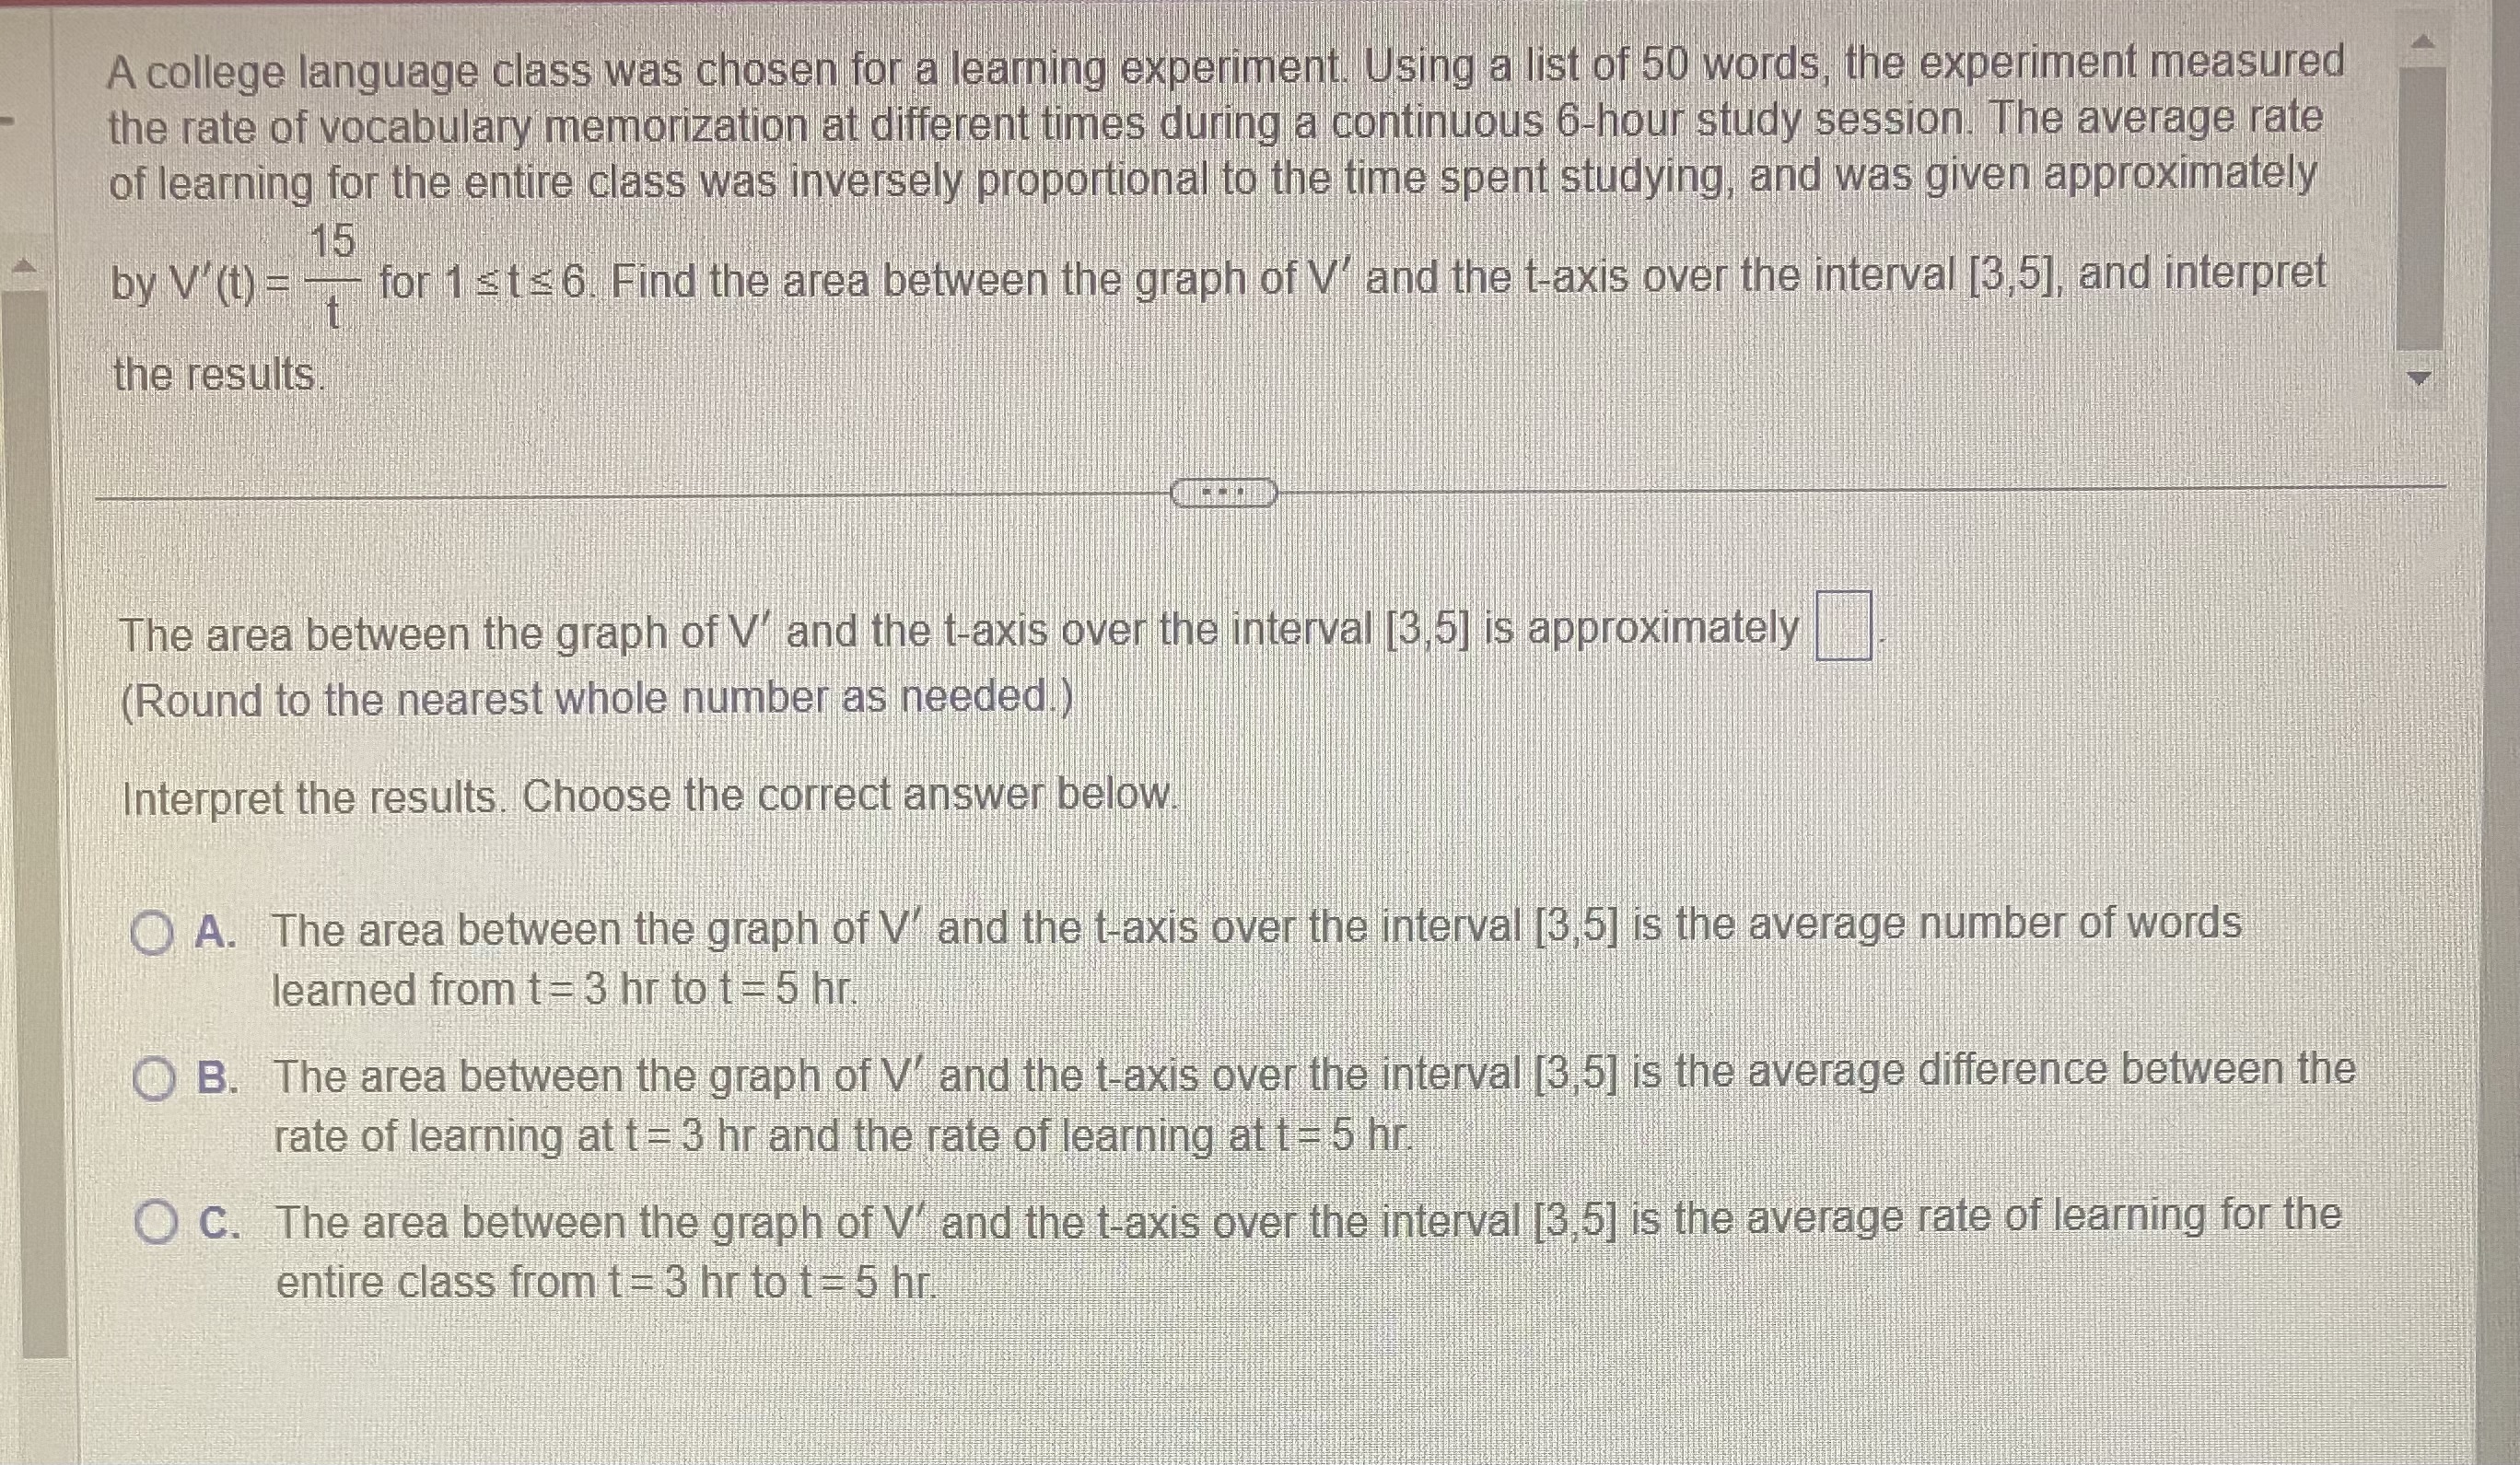
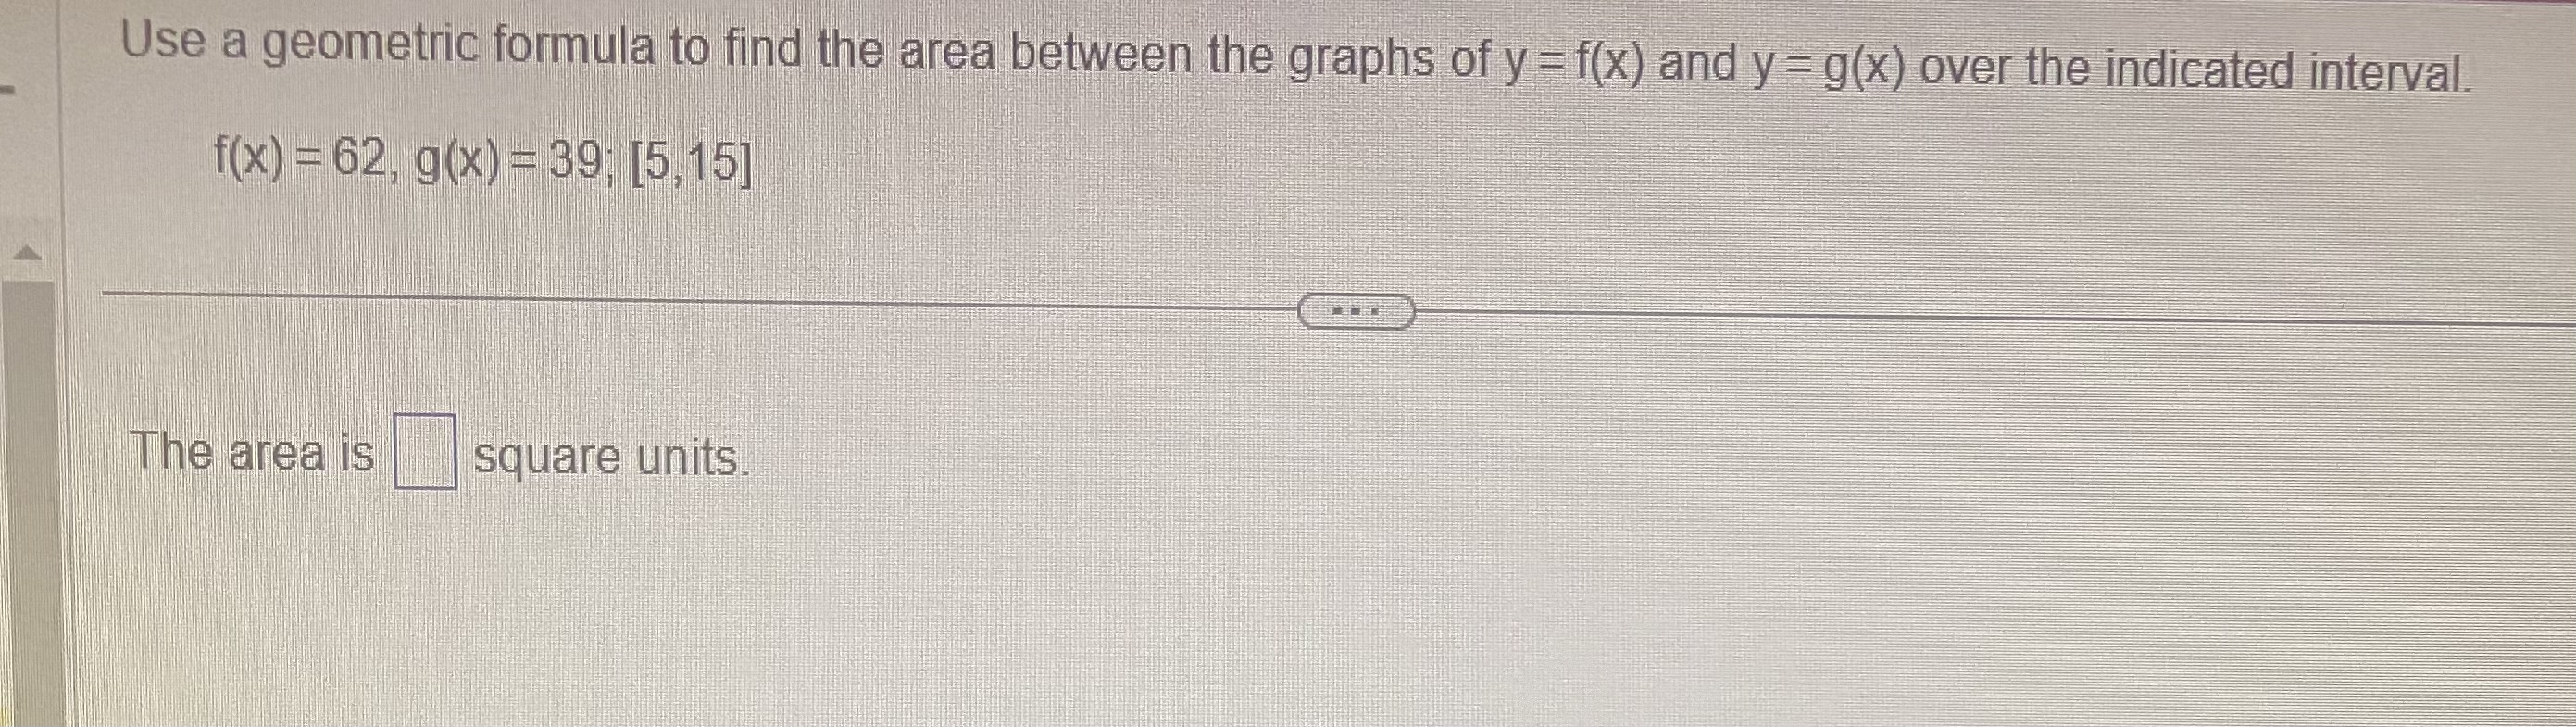
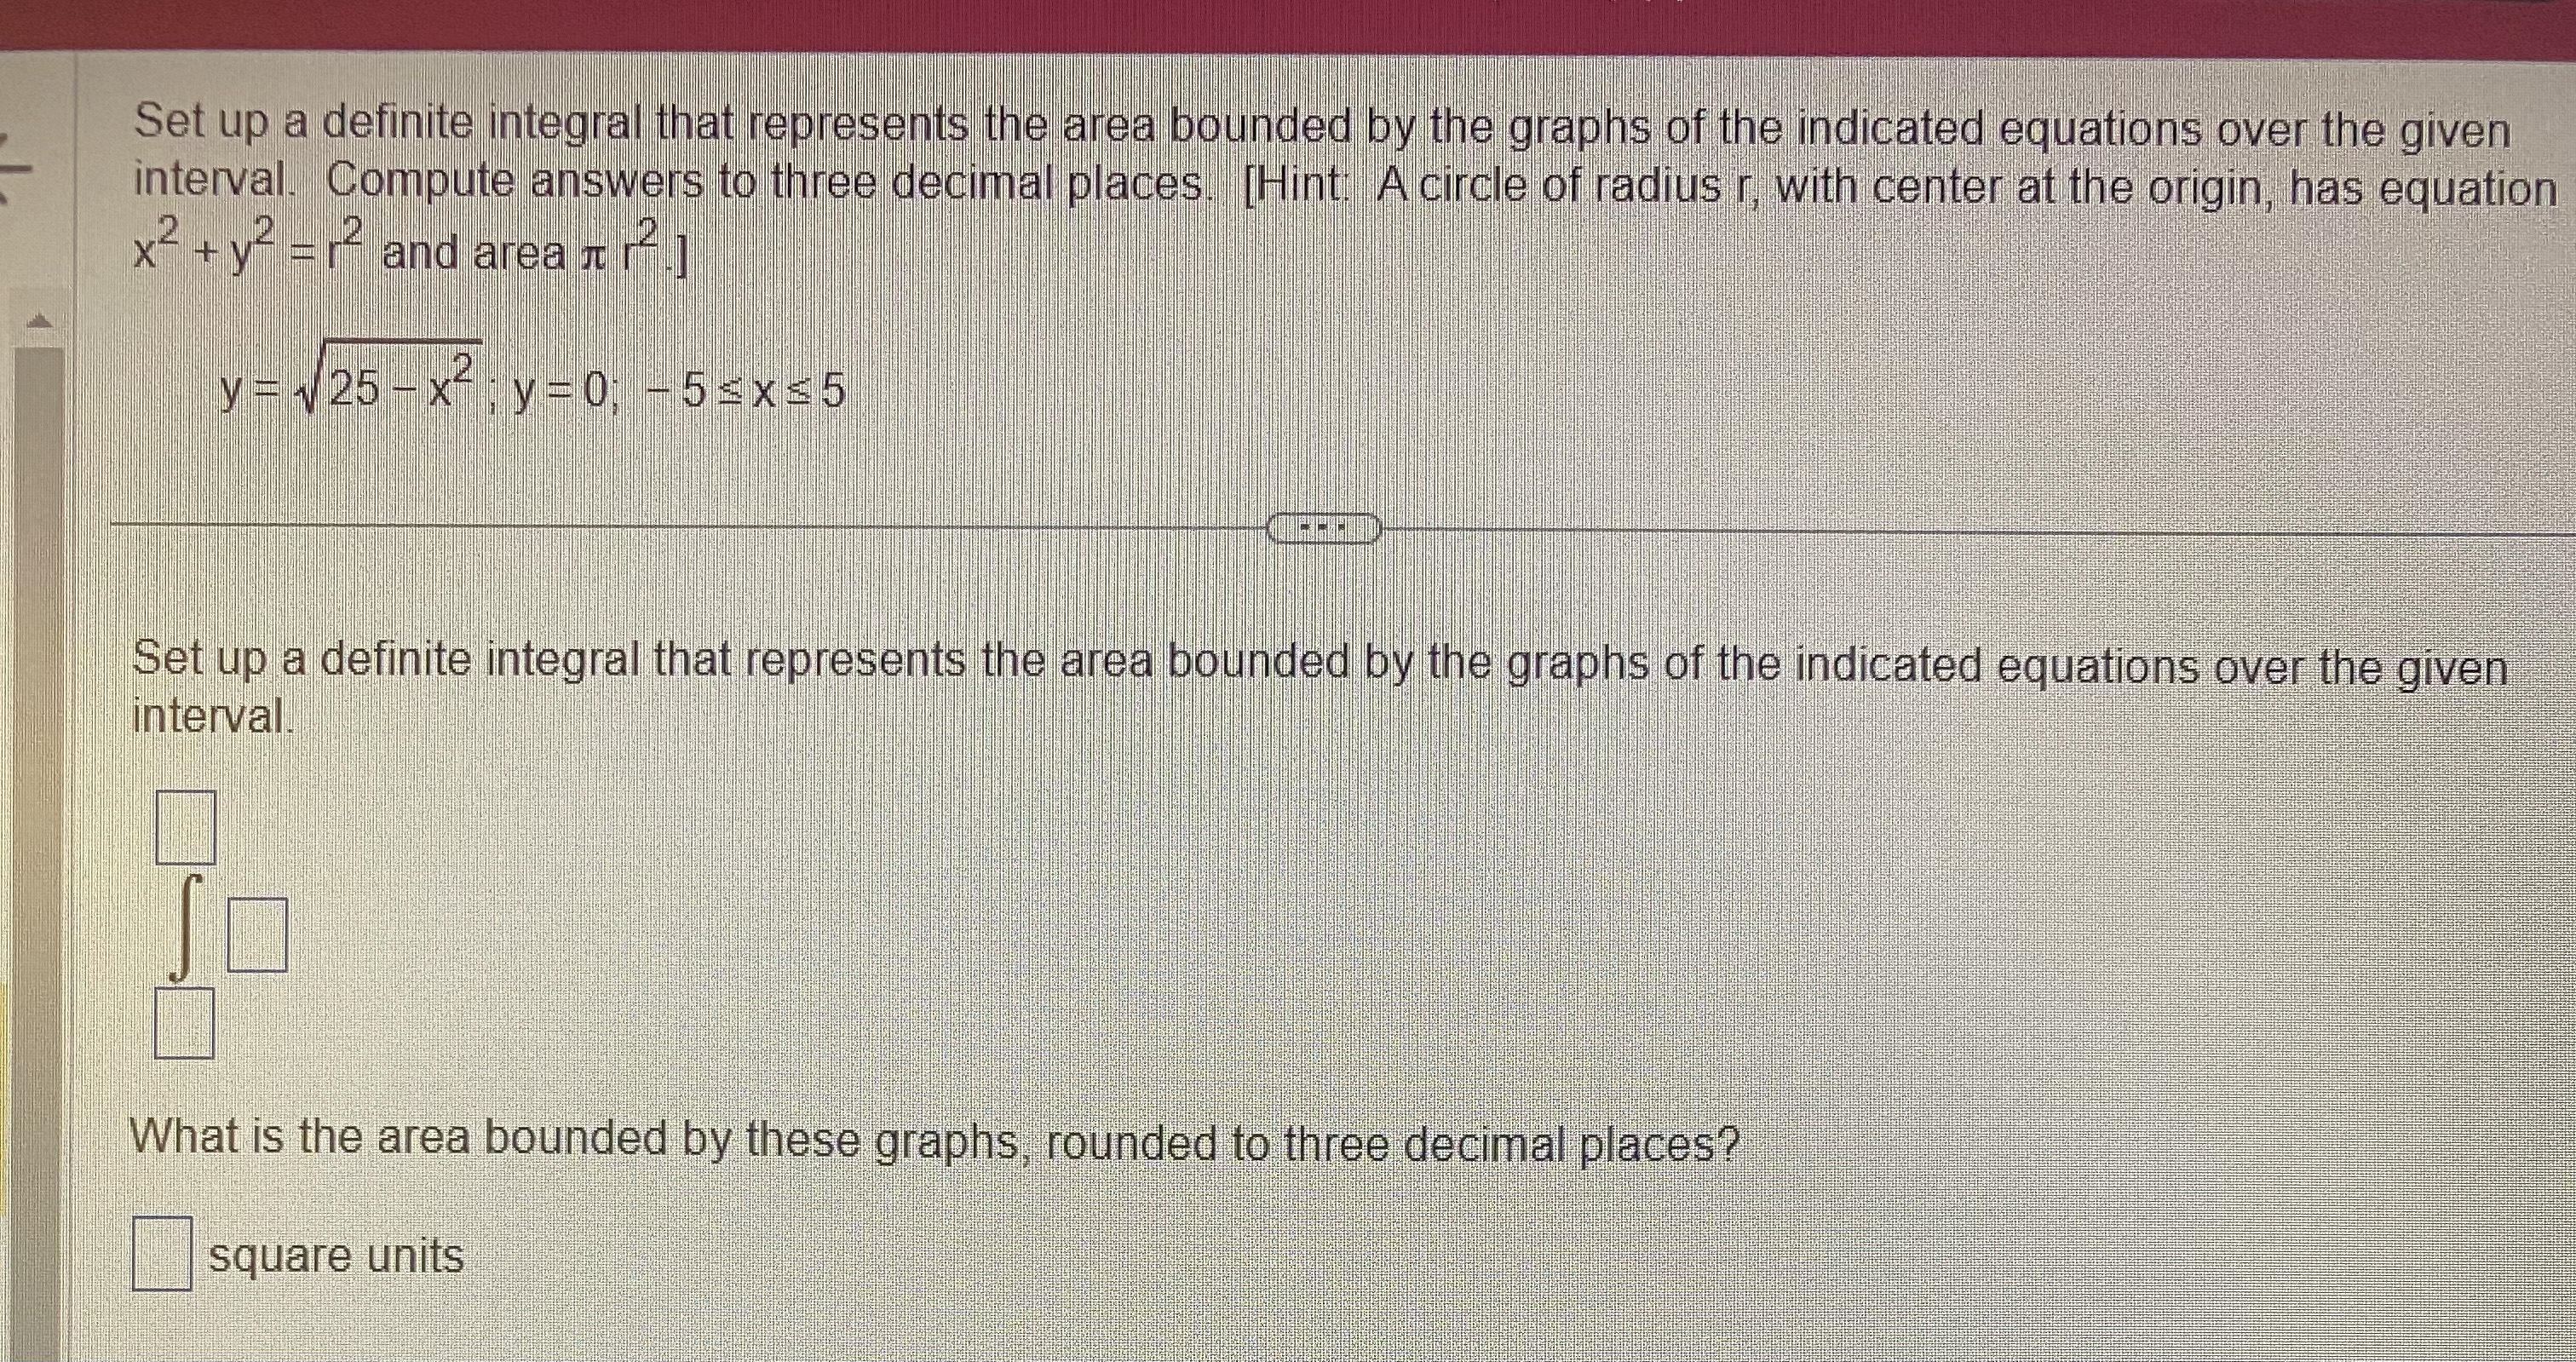
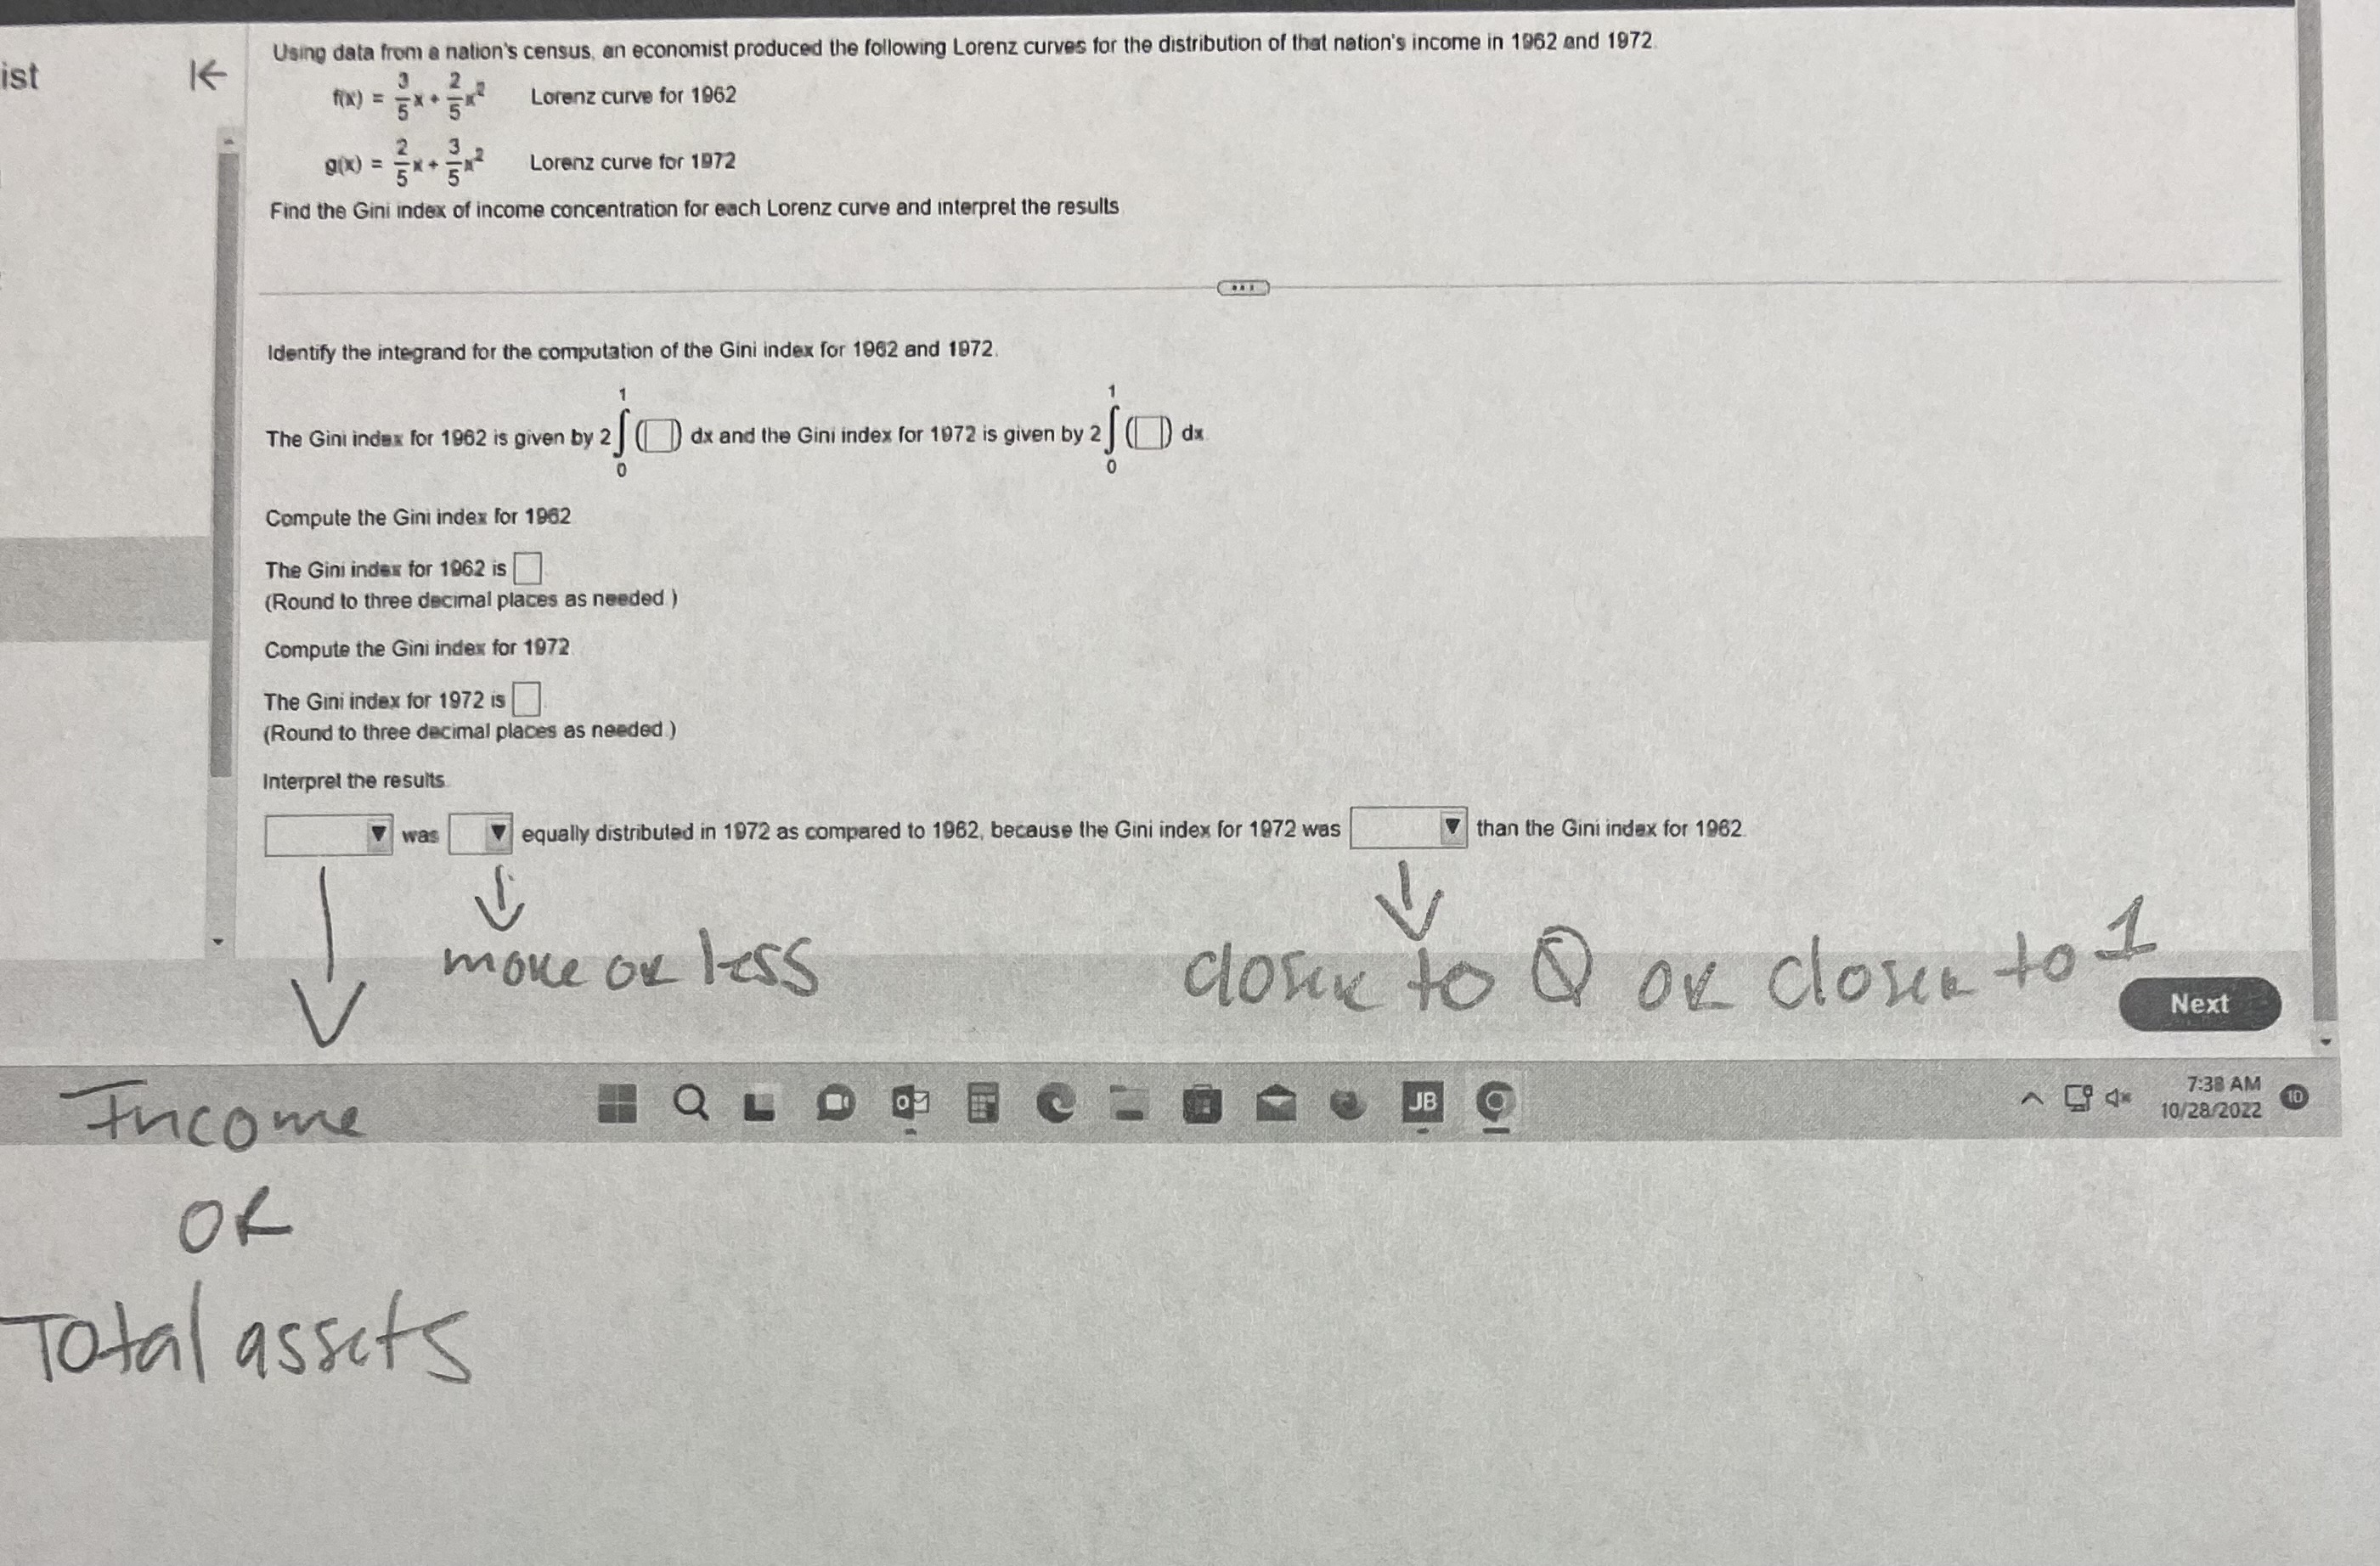
A college language class was chosen for a learning experiment. Using a list of 50 words, the experiment measured the rate of vocabulary memorization at different times during a continuous 6-hour study session. The average rate of learning for the entire class was inversely proportional to the time spent studying, and was given approximately 15 by V (t) = for 1 = t= 6. Find the area between the graph of V' and the t-axis over the interval [3,5], and interpret the results The area between the graph of V' and the t-axis over the interval [3,5] is approximately (Round to the nearest whole number as needed.) Interpret the results. Choose the correct answer below O A. The area between the graph of V' and the t-axis over the interval [3,5] is the average number of words learned from t= 3 hr to t = 5 hr O B. The area between the graph of V' and the t-axis over the interval [3,5] is the average difference between the rate of learning at t = 3 hr and the rate of learning at t = 5 hr. O C. The area between the graph of V' and the t-axis over the interval [3,5] is the average rate of learning for the entire class from t= 3 hr to t=5 hr.Use a geometric formula to find the area between the graphs of y = f(x) and y = g(x) over the indicated interval. f(x) =62, g(x) = 39: [5,15] The area is square unitsSet up a definite integral that represents the area bounded by the graphs of the indicated equations over the given interval. Compute answers to three decimal places. [Hint: A circle of radius r, with center at the origin, has equation x2 + y2 -12 and area n - ] y = 1 25 - x y =0 - 5Ex=5 Set up a definite integral that represents the area bounded by the graphs of the indicated equations over the given interval. What is the area bounded by these graphs, rounded to three decimal places? square unitsist K Using data from a nation's census, an economist produced the following Lorenz curves for the distribution of that nation's income in 1962 and 1972 3 2 0 Lorenz curve for 1962 2 5K Lorenz curve for 1972 Find the Gini index of income concentration for each Lorenz curve and interpret the results Identify the integrand for the computation of the Gini index for 1962 and 1972. The Gini index for 1962 is given by 2 ) ( ) dx and the Gini index for 1972 is given by 2 J ([ ) dx Compute the Gini index for 1962 The Gini index for 1962 is (Round to three decimal places as needed ) Compute the Gini index for 1972 The Gini index for 1972 is (Round to three decimal places as needed ) Interpret the results was equally distributed in 1972 as compared to 1962, because the Gini index for 1972 was than the Gini index for 1962 V move or less close to O or close to I Next Income 7:38 AM 10/28/2022 10 OK Total assetsFind the area bounded by the graphs of the indicated equations over the given interval y = -x2+24, y=0; -3
Step by Step Solution
There are 3 Steps involved in it

Get step-by-step solutions from verified subject matter experts