

Question: homework 8.4 8.4.8- Assigned Media Data show that men between the ages of 20 and 29 in a general population have a mean height of
homework 8.4
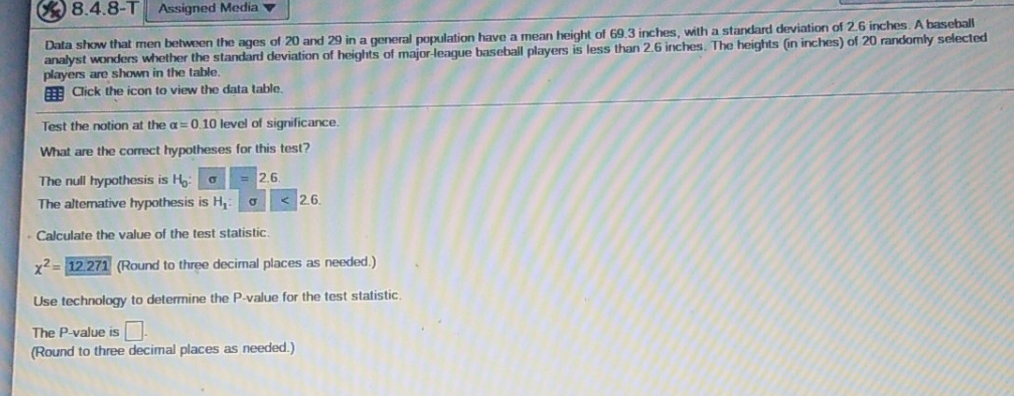
8.4.8- Assigned Media Data show that men between the ages of 20 and 29 in a general population have a mean height of 69.3 inches, with a standard deviation of 2.6 inches. A baseball analyst wonders whether the standard deviation of heights of major league baseball players is less than 2.6 inches. The heights (in inches) of 20 randomly selected players are shown in the table. Click the icon to view the data table. Test the notion at the a =0.10 level of significance. What are the correct hypotheses for this test? The null hypothesis is Ho: 2.6 The alternative hypothesis is H, 26. Calculate the value of the test statistic. x2= 12.271 (Round to three decimal places as needed.) Use technology to determine the P-value for the test statistic. The P-value is (Round to three decimal places as needed.)
Step by Step Solution
There are 3 Steps involved in it

Get step-by-step solutions from verified subject matter experts