

Question: Homework Assignment 1 (adapted from Case Study 1 of Chapter 4, Business Analytics): Answer the questions below using the Answers worksheet, inputting each respective answer
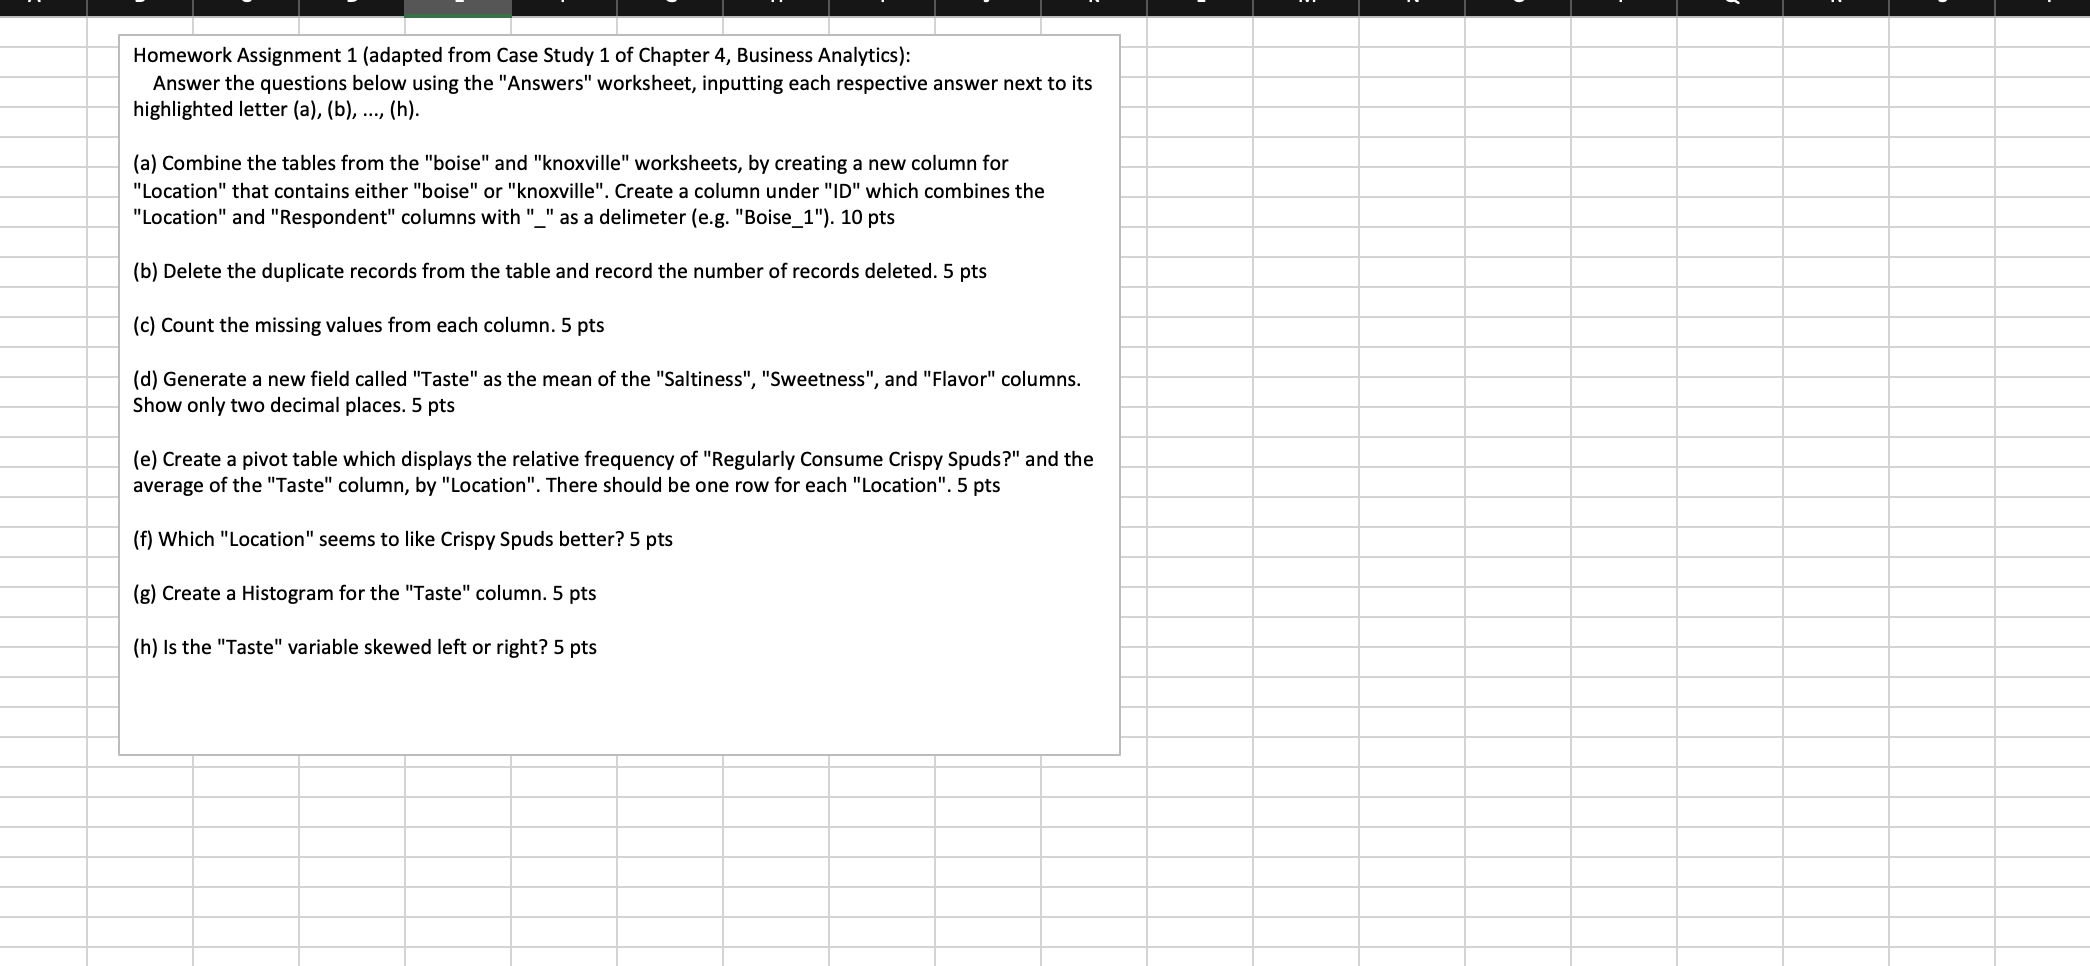
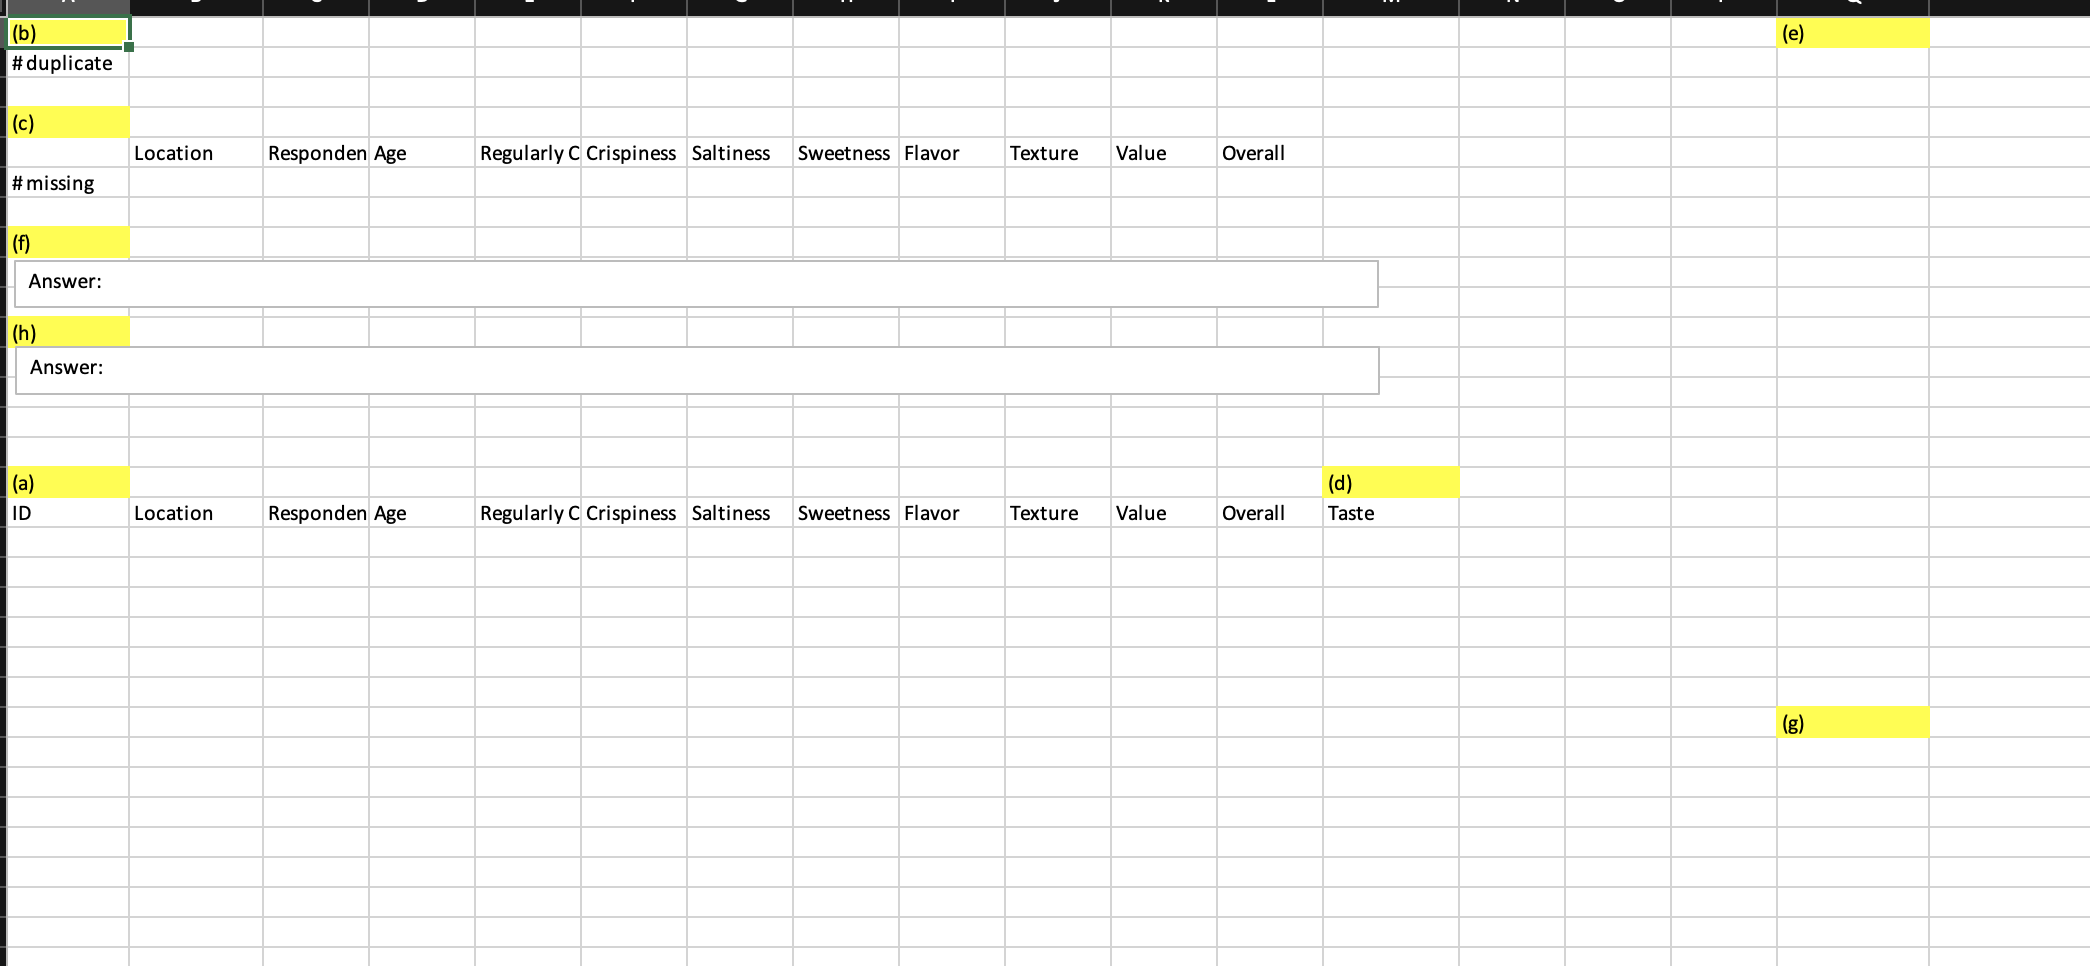


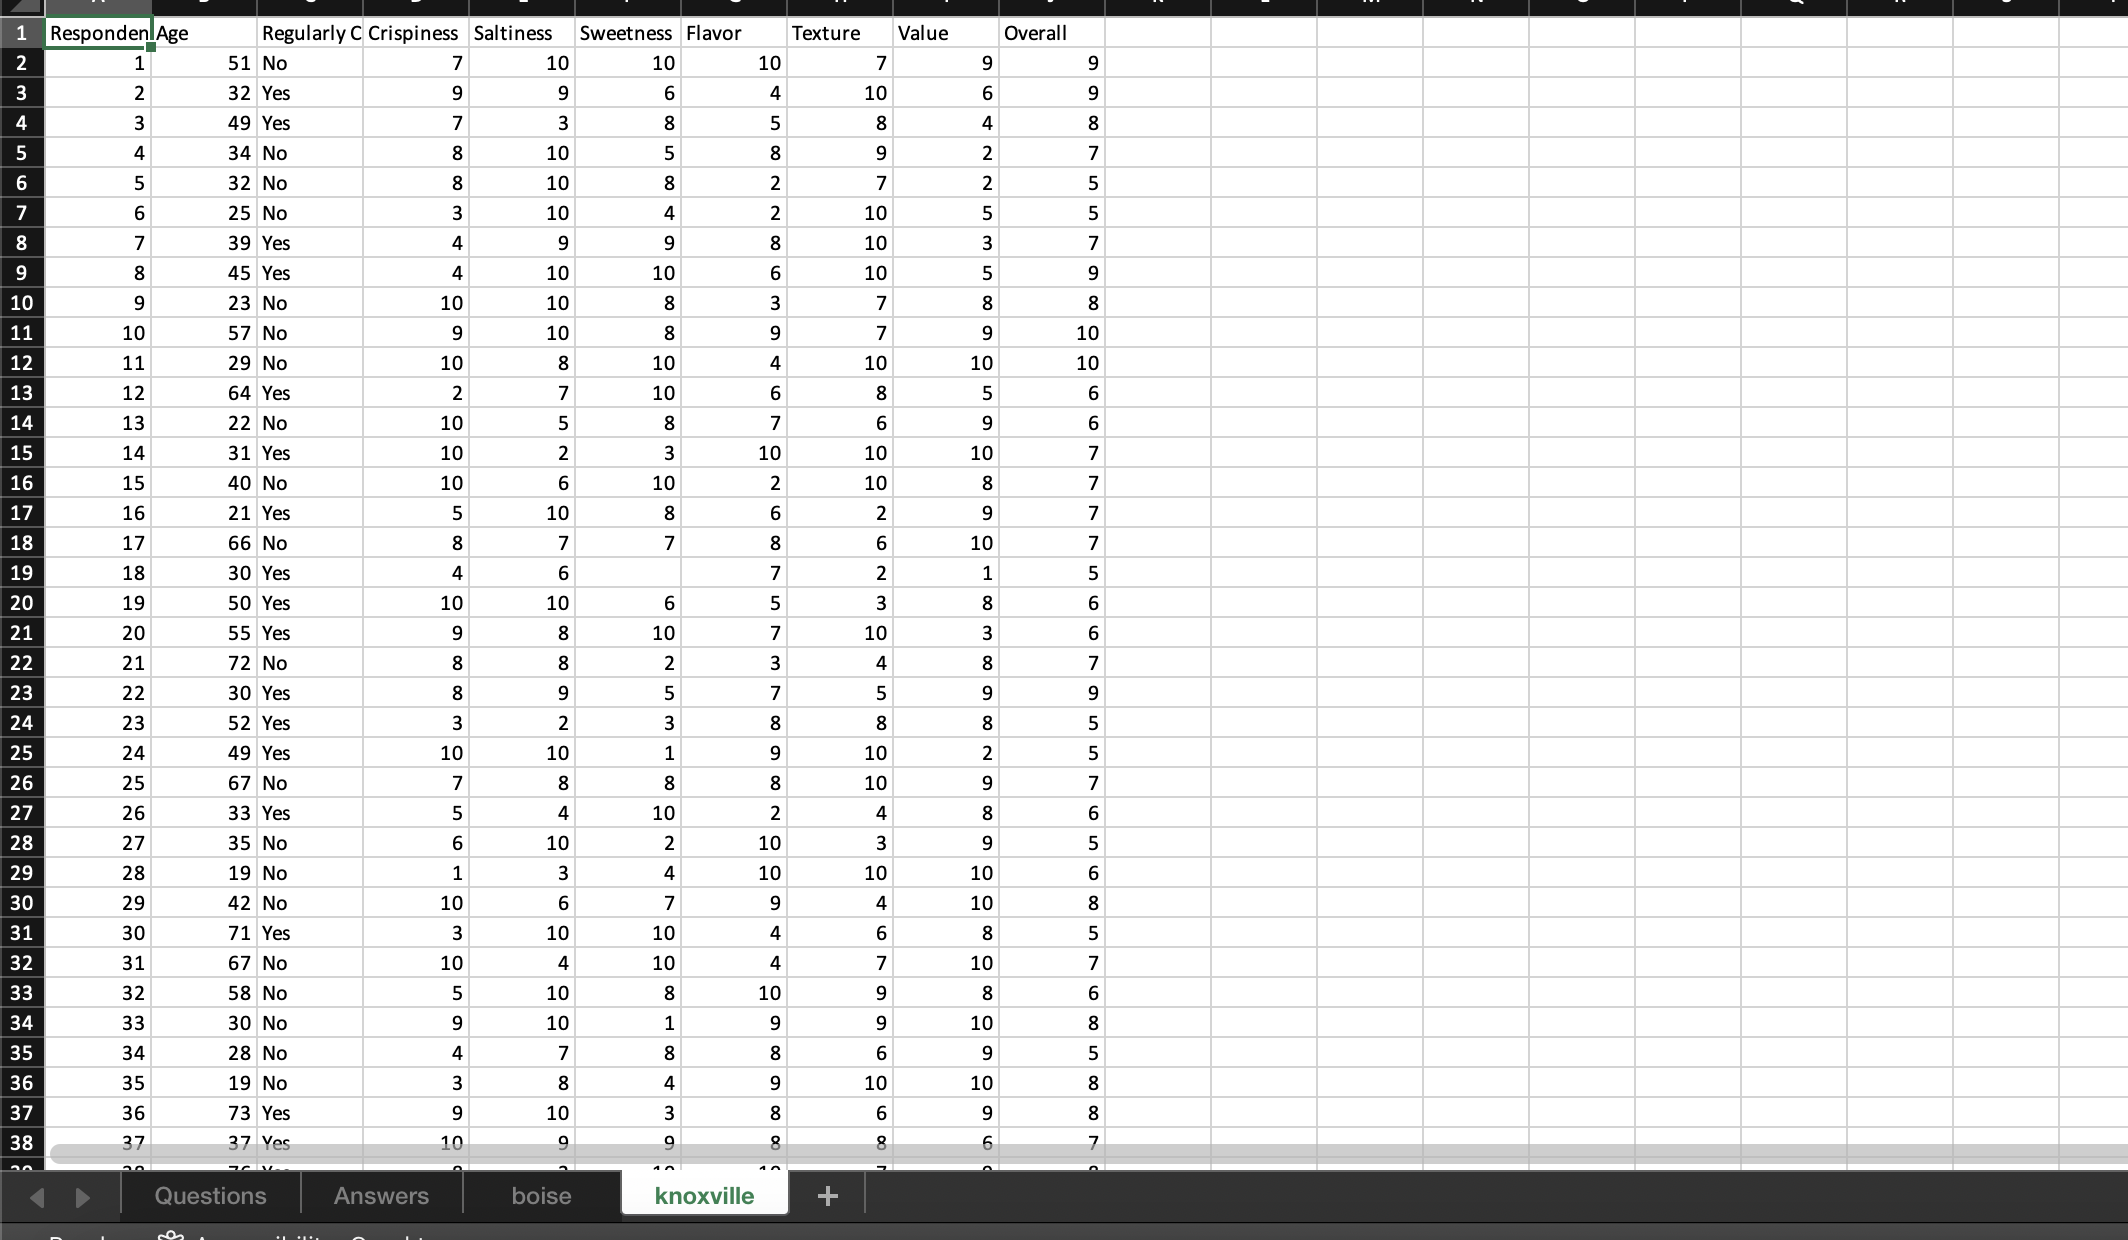
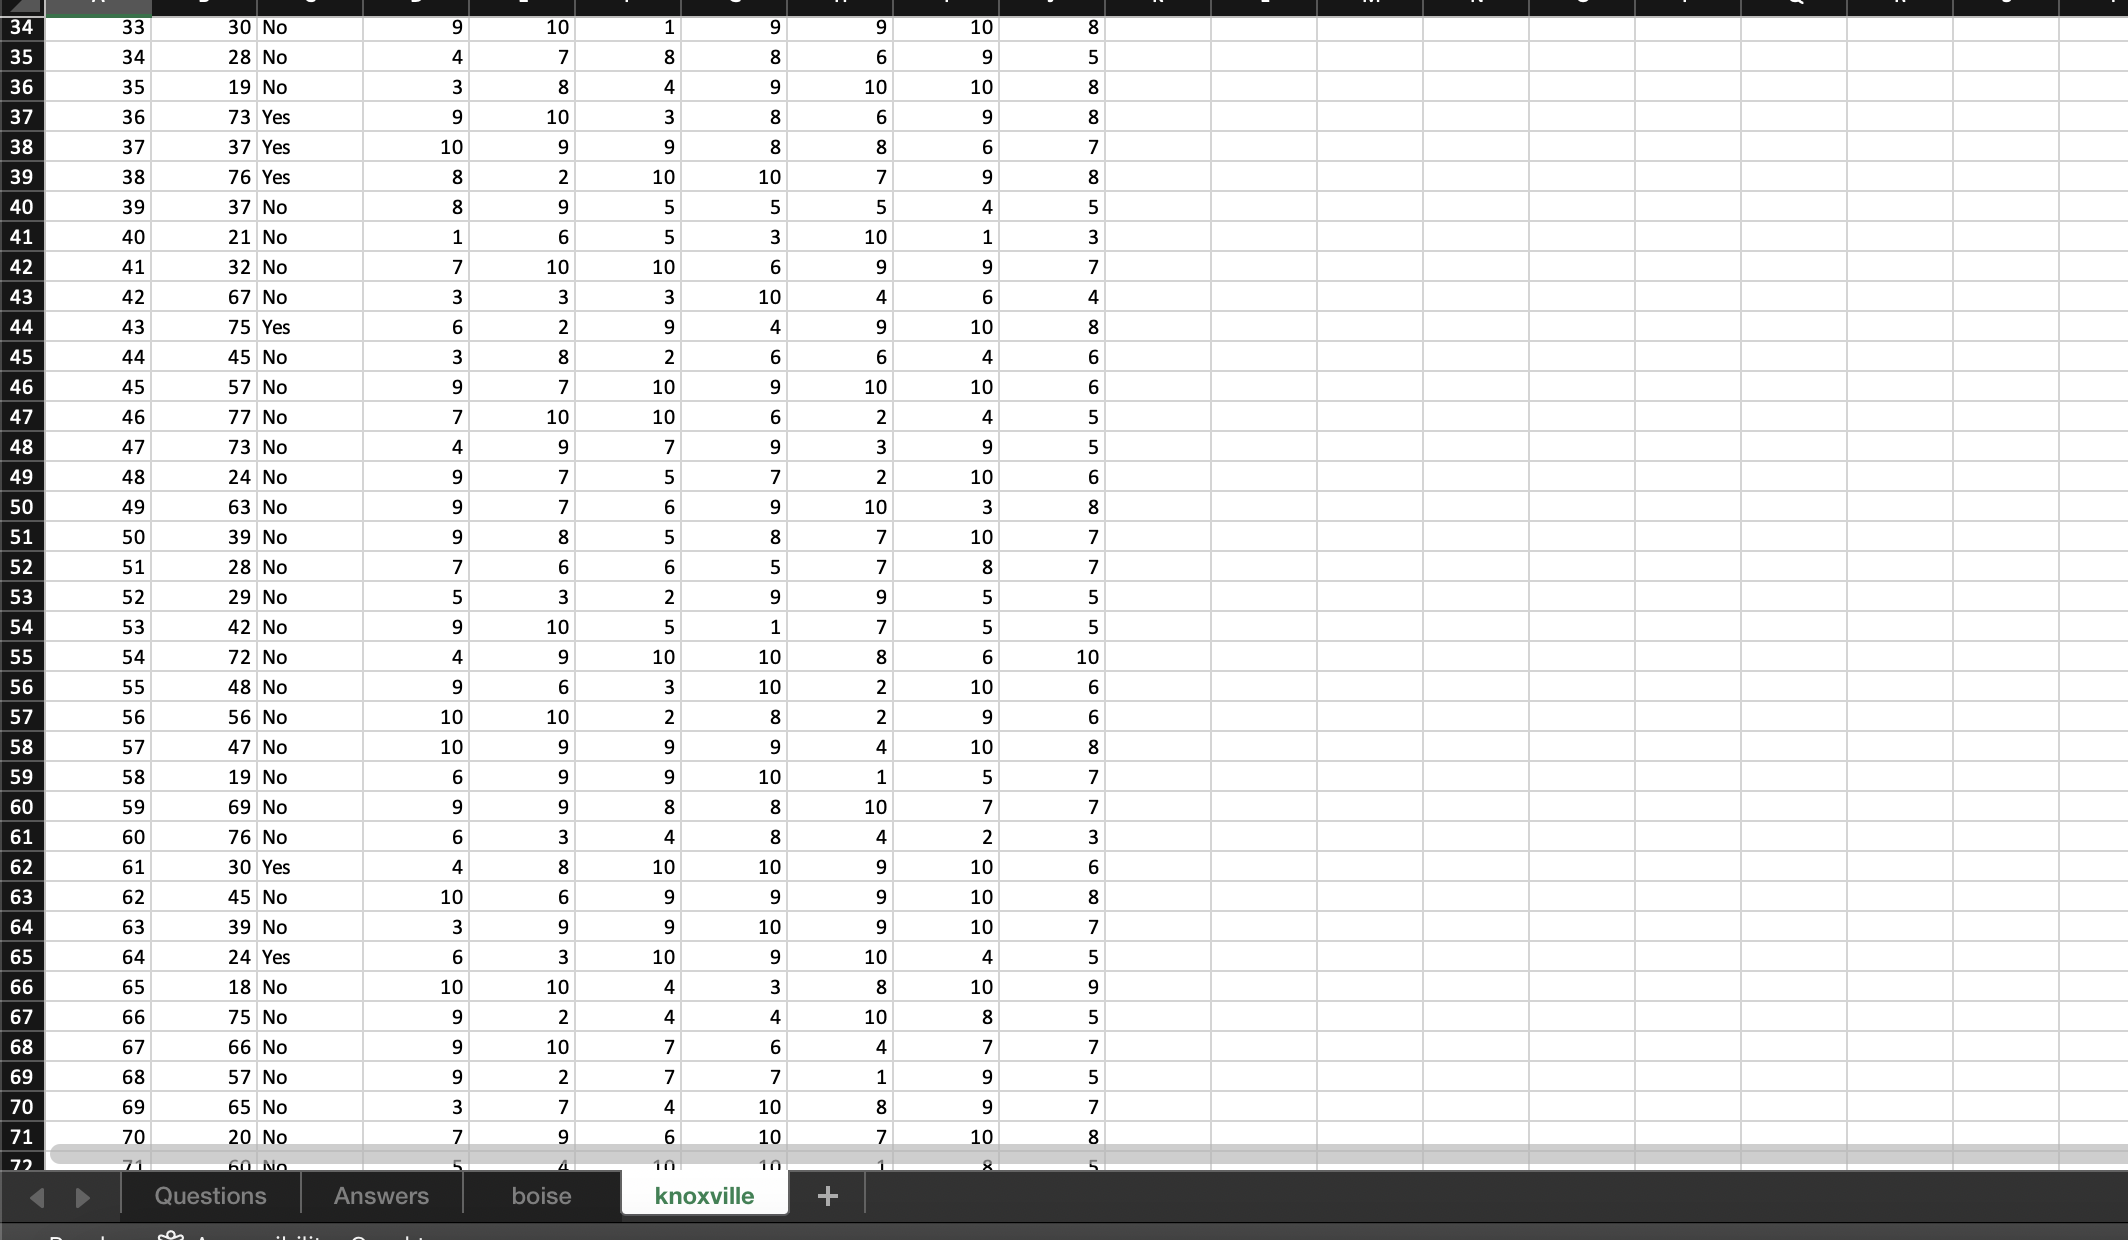
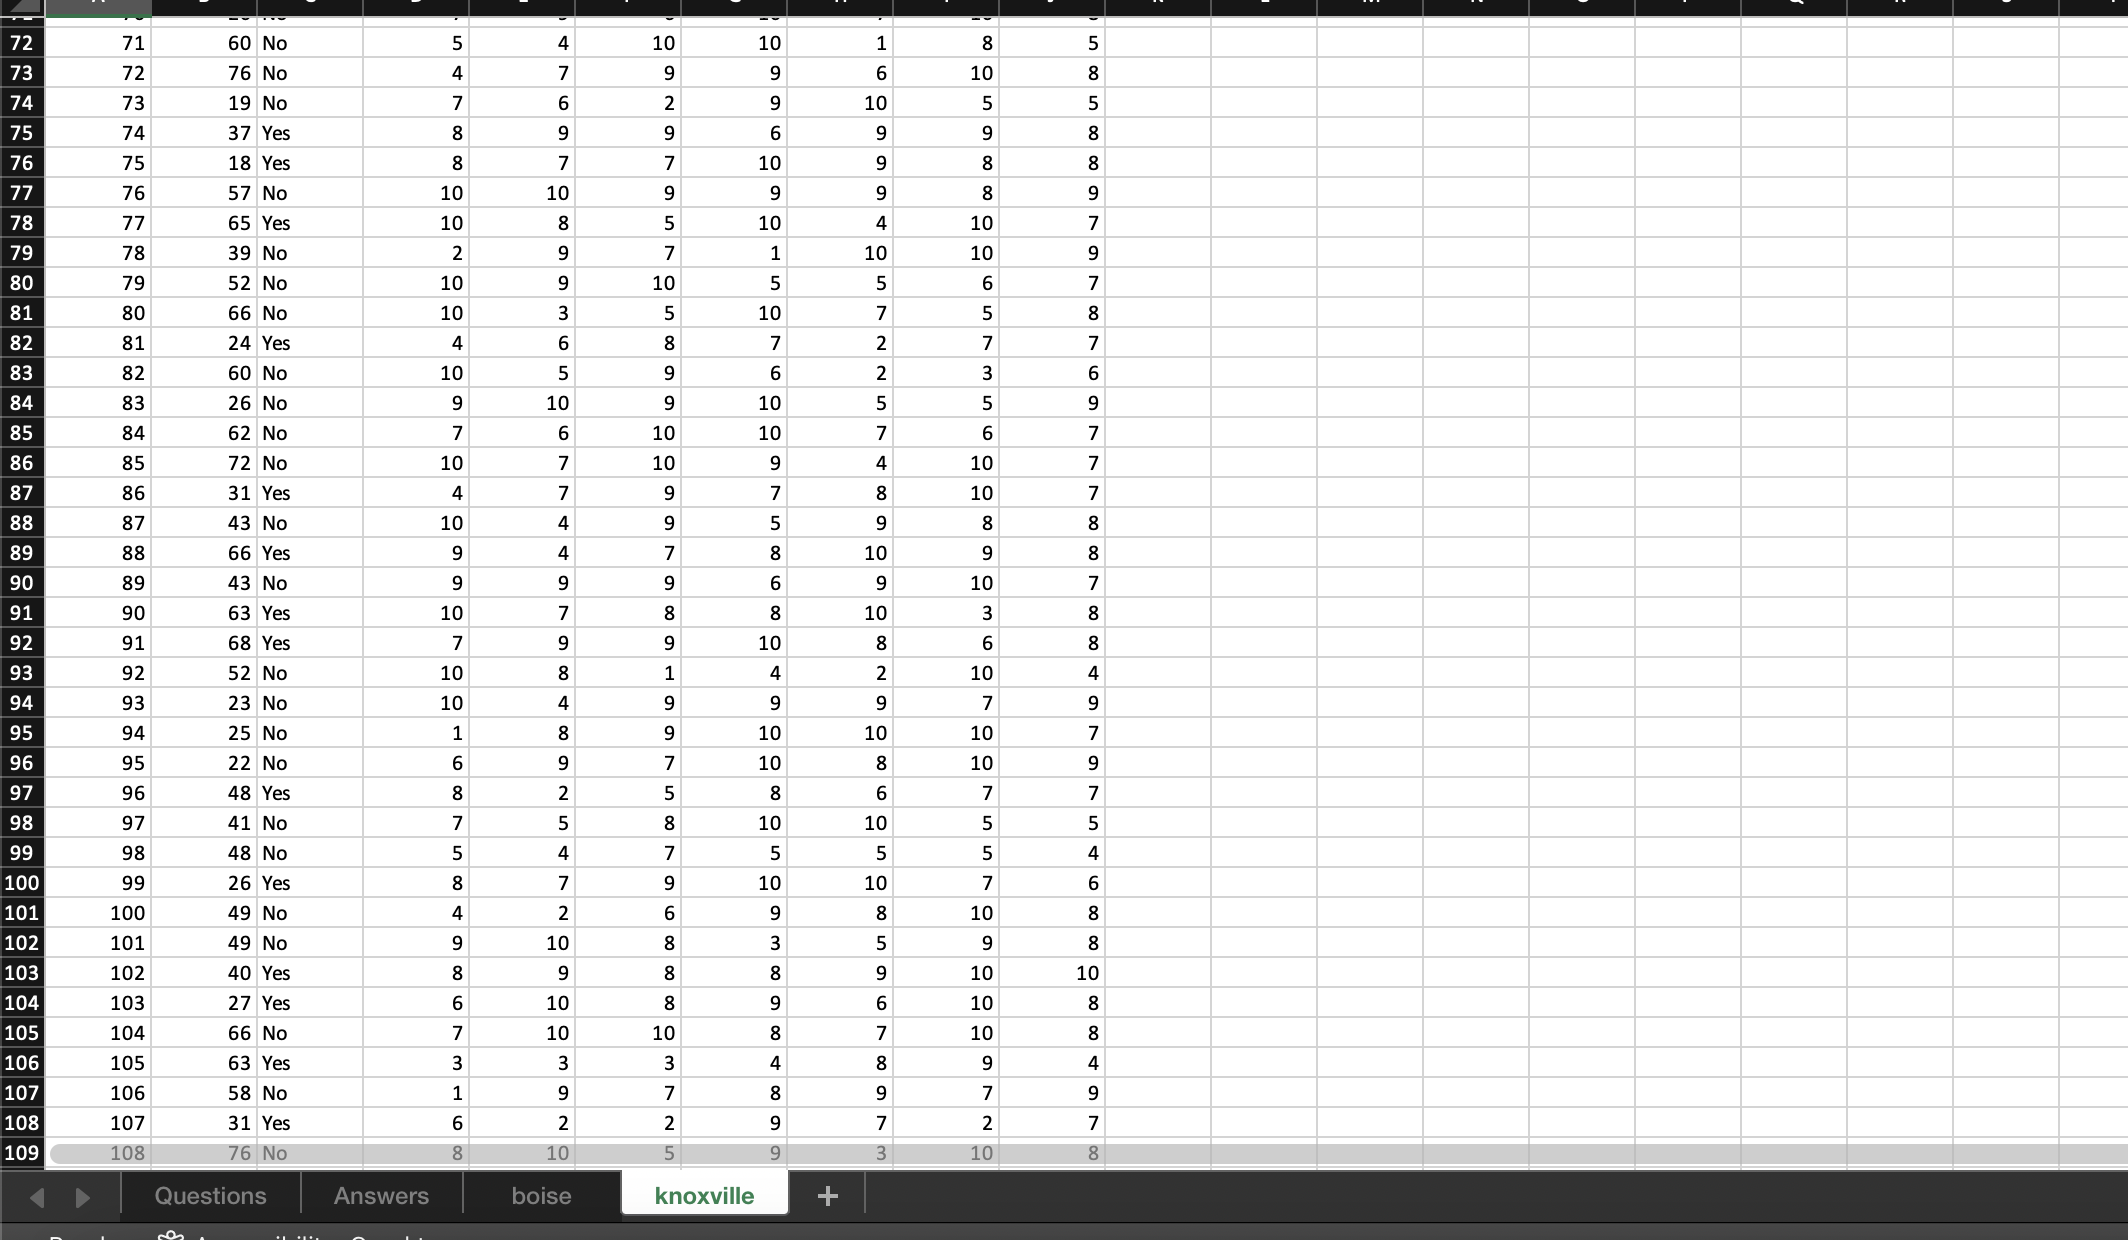
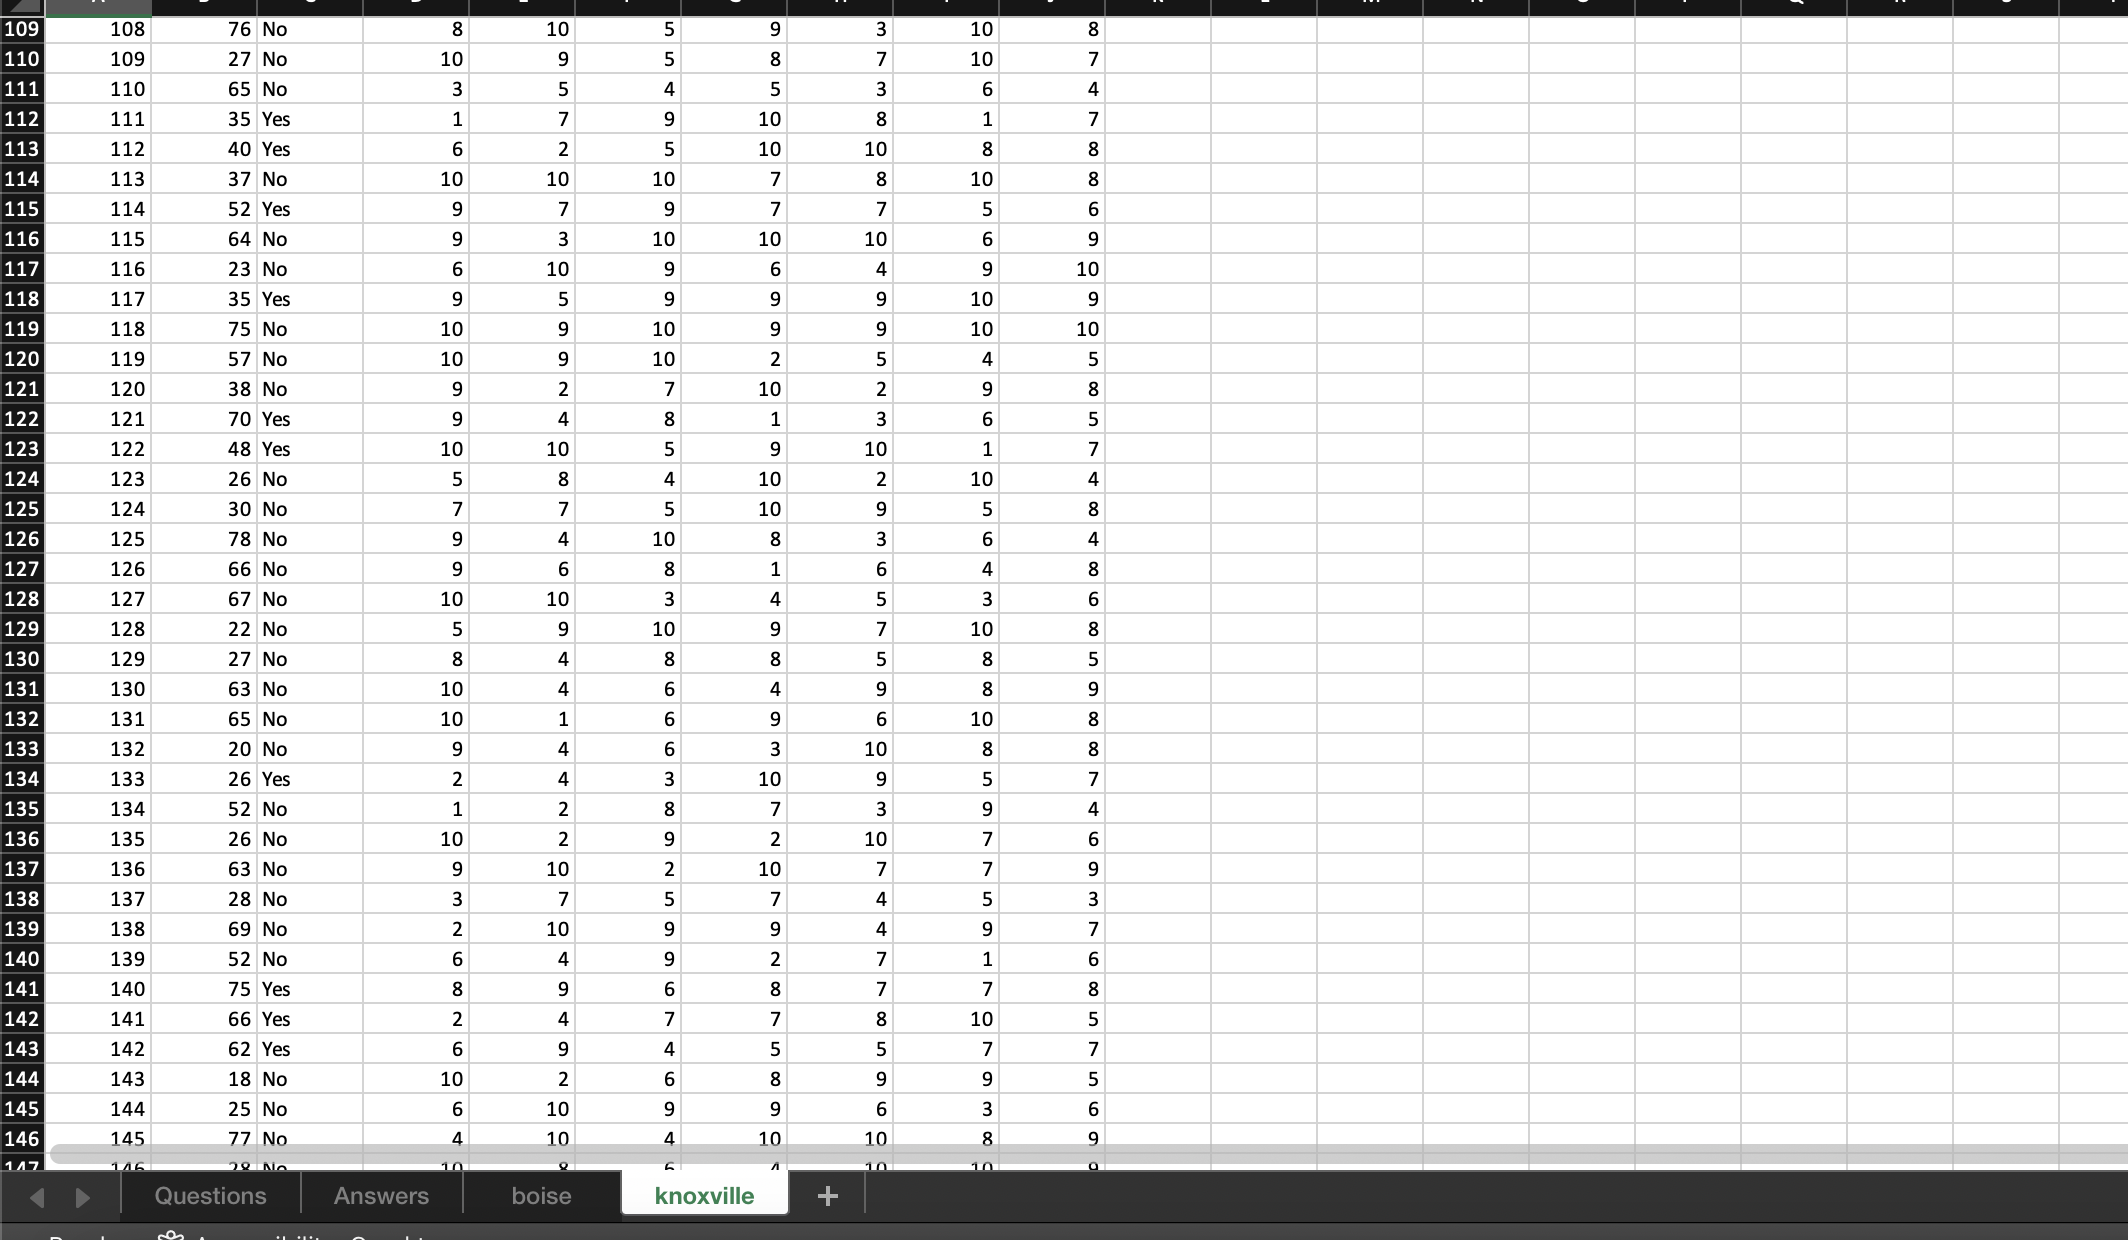
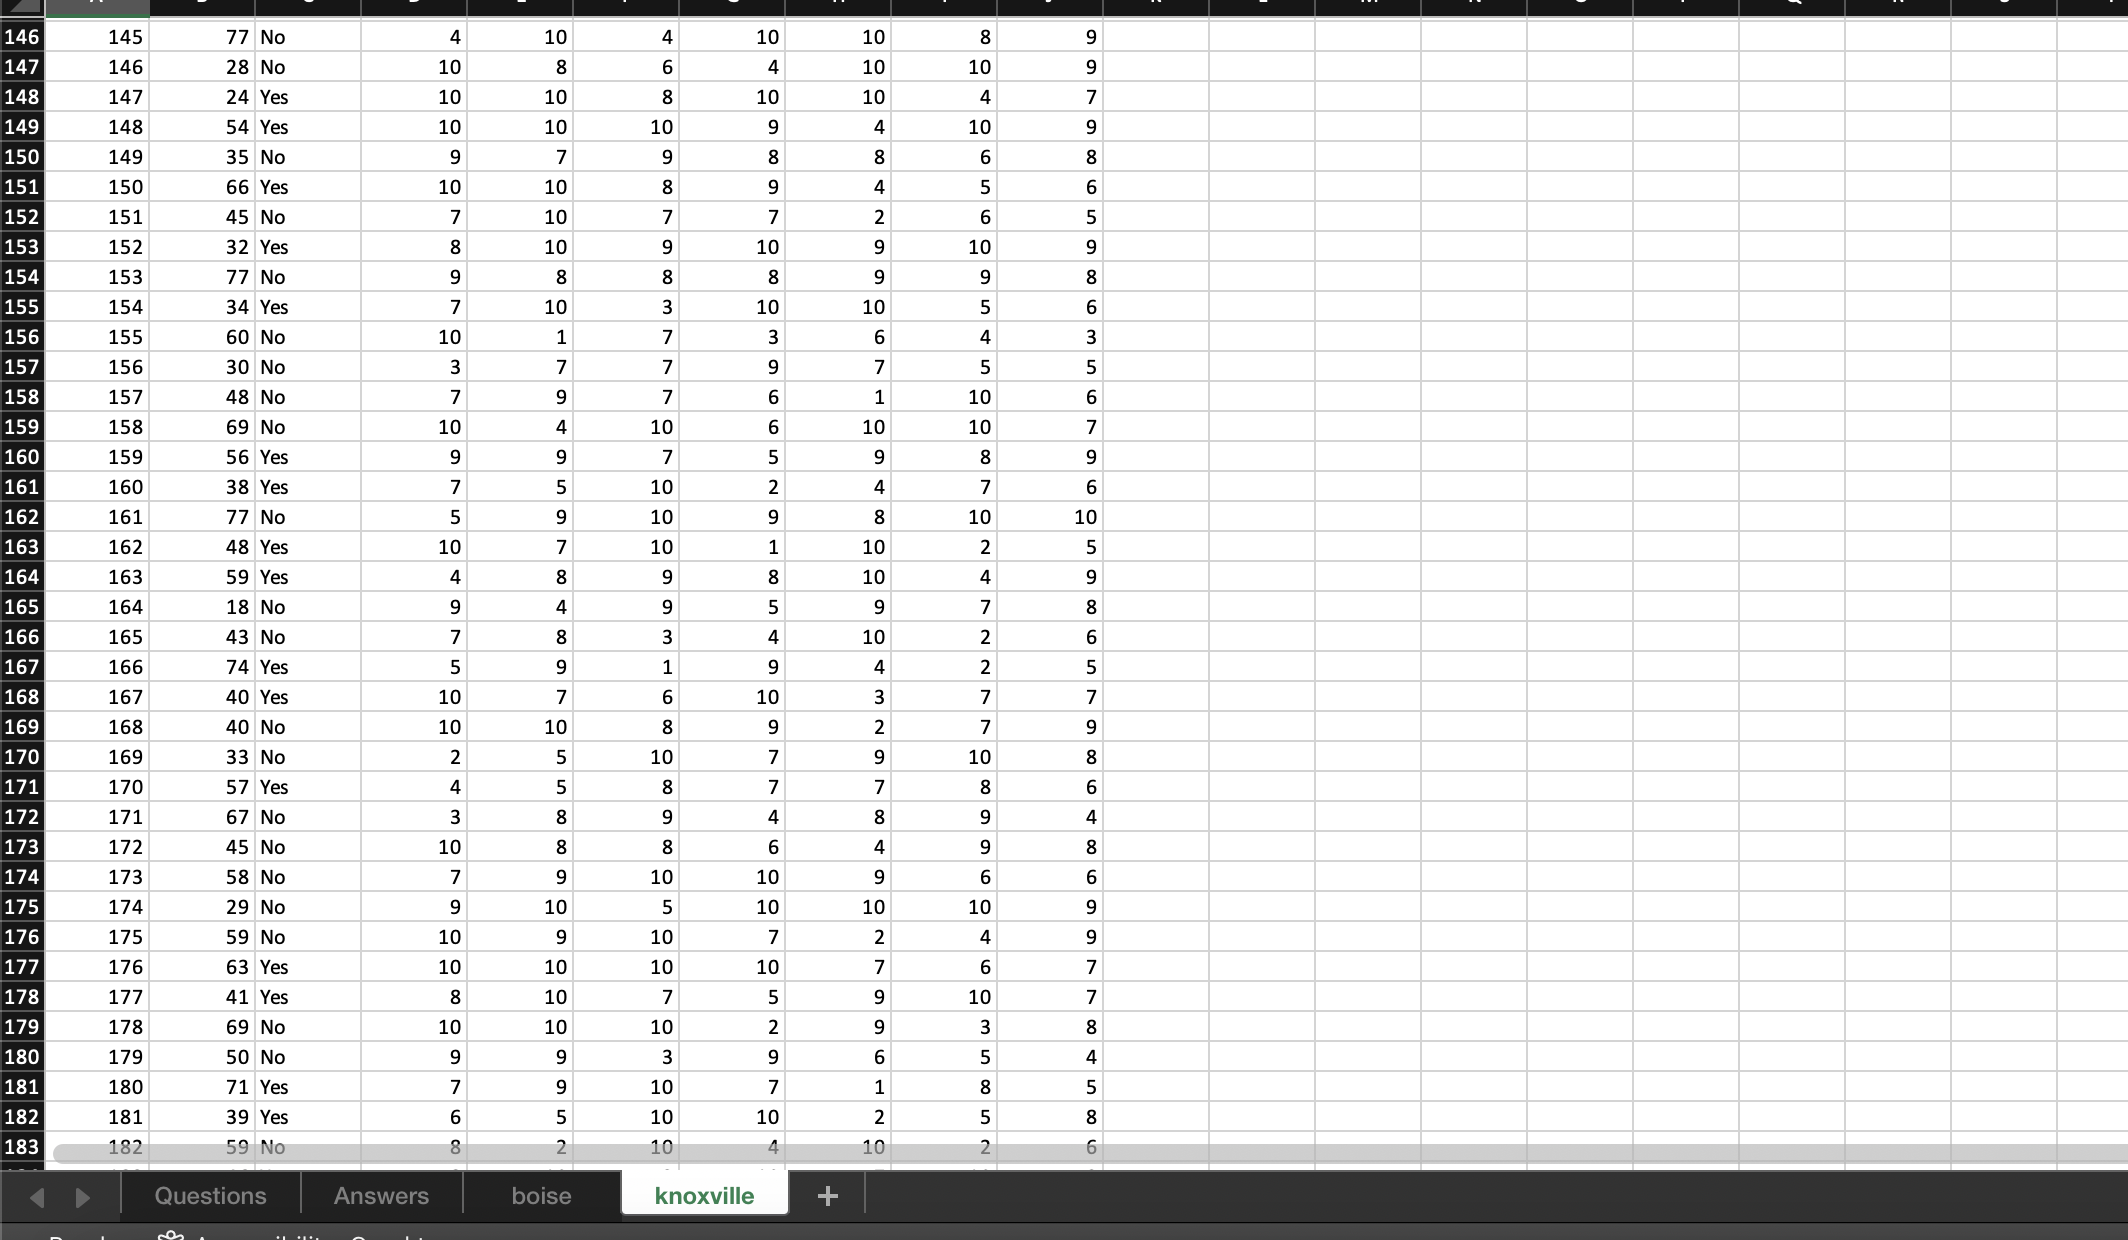


Homework Assignment 1 (adapted from Case Study 1 of Chapter 4, Business Analytics): Answer the questions below using the "Answers" worksheet, inputting each respective answer next to its highlighted letter (a), (b), ..., (h). (a) Combine the tables from the "boise" and "knoxville" worksheets, by creating a new column for "Location" that contains either "boise" or "knoxville". Create a column under "ID" which combines the "Location" and "Respondent" columns with "_" as a delimeter (e.g. "Boise_1"). 10 pts (b) Delete the duplicate records from the table and record the number of records deleted. 5 pts (c) Count the missing values from each column. 5 pts (d) Generate a new field called "Taste" as the mean of the "Saltiness", "Sweetness", and "Flavor" columns. Show only two decimal places. 5 pts (e) Create a pivot table which displays the relative frequency of "Regularly Consume Crispy Spuds?" and the average of the "Taste" column, by "Location". There should be one row for each "Location". 5 pts (f) Which "Location" seems to like Crispy Spuds better? 5 pts (g) Create a Histogram for the "Taste" column. 5 pts (h) Is the "Taste" variable skewed left or right? 5 pts (b) \# duplicate (c) \# missing (f) Answer: (h) Answer: (a) ID Location Regularly C Crispiness Saltiness Sweetness Flavor Texture Value (e) Homework Assignment 1 (adapted from Case Study 1 of Chapter 4, Business Analytics): Answer the questions below using the "Answers" worksheet, inputting each respective answer next to its highlighted letter (a), (b), ..., (h). (a) Combine the tables from the "boise" and "knoxville" worksheets, by creating a new column for "Location" that contains either "boise" or "knoxville". Create a column under "ID" which combines the "Location" and "Respondent" columns with "_" as a delimeter (e.g. "Boise_1"). 10 pts (b) Delete the duplicate records from the table and record the number of records deleted. 5 pts (c) Count the missing values from each column. 5 pts (d) Generate a new field called "Taste" as the mean of the "Saltiness", "Sweetness", and "Flavor" columns. Show only two decimal places. 5 pts (e) Create a pivot table which displays the relative frequency of "Regularly Consume Crispy Spuds?" and the average of the "Taste" column, by "Location". There should be one row for each "Location". 5 pts (f) Which "Location" seems to like Crispy Spuds better? 5 pts (g) Create a Histogram for the "Taste" column. 5 pts (h) Is the "Taste" variable skewed left or right? 5 pts (b) \# duplicate (c) \# missing (f) Answer: (h) Answer: (a) ID Location Regularly C Crispiness Saltiness Sweetness Flavor Texture Value (e)
Step by Step Solution
There are 3 Steps involved in it

Get step-by-step solutions from verified subject matter experts