

Question: Homework: Assignment 2 Question 59, 22.4 Question 38 (Algo) Part 1 of 3 HW Score: 40%, 26 of 65 points O Points: 0 of
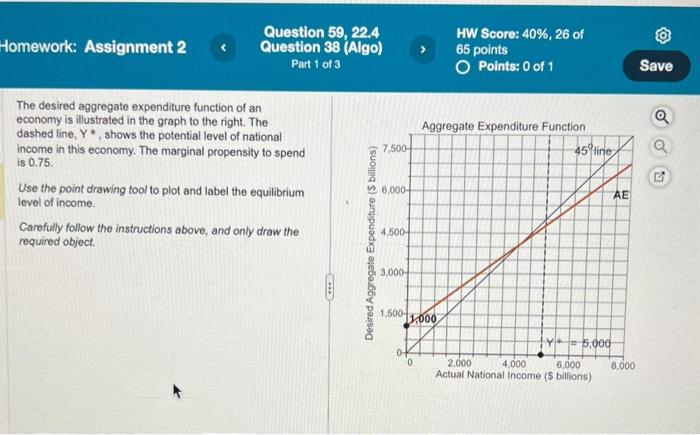
Homework: Assignment 2 Question 59, 22.4 Question 38 (Algo) Part 1 of 3 HW Score: 40%, 26 of 65 points O Points: 0 of 1 The desired aggregate expenditure function of an economy is illustrated in the graph to the right. The dashed line, Y, shows the potential level of national income in this economy. The marginal propensity to spend is 0.75. Use the point drawing tool to plot and label the equilibrium level of income. Carefully follow the instructions above, and only draw the required object. Desired Aggregate Expenditure ($ billions) 7,500- 6,000- 4,500- 3,000- Aggregate Expenditure Function 1.500-1000 0 45 line AE 5,000 6,000 8,000 2,000 4,000 Actual National Income ($ billions) Save
Step by Step Solution
There are 3 Steps involved in it

Get step-by-step solutions from verified subject matter experts