

Question: Homework Assignment #3 Using the data below, conduct all necessary calculations and answer all questions on each tab. When complete, you will upload your homework
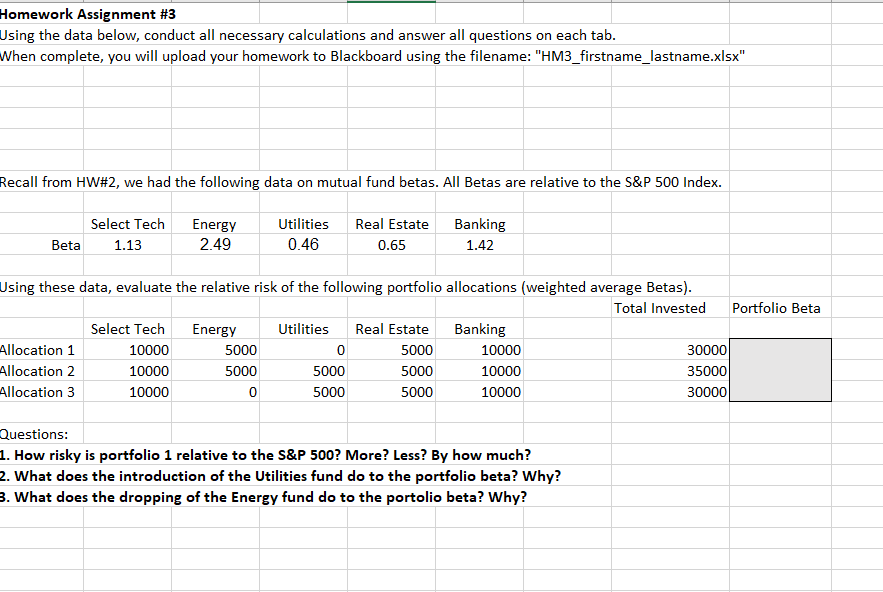
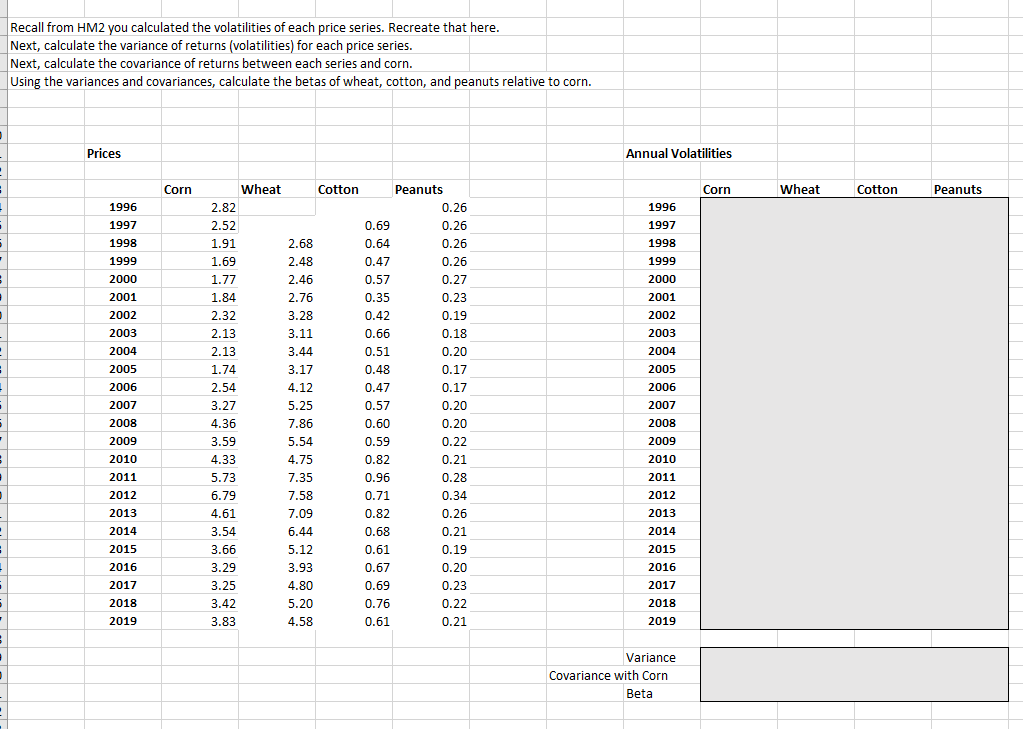
Homework Assignment \#3 Using the data below, conduct all necessary calculations and answer all questions on each tab. When complete, you will upload your homework to Blackboard using the filename: "HM3_firstname_lastname.xlsx" Recall from HW\#2, we had the following data on mutual fund betas. All Betas are relative to the S\&P 500 Index. \begin{tabular}{|c|c|c|c|c|c|} \hline & Select Tech & Energy & Utilities & Real Estate & Banking \\ \hline Beta & 1.13 & 2.49 & 0.46 & 0.65 & 1.42 \\ \hline \end{tabular} Using these data, evaluate the relative risk of the following portfolio allocations (weighted average Betas). \begin{tabular}{|l|r|r|r|r|r|r|r|} \hline & & & & & Total Invested & Portfolio Beta \\ \hline Allocation 1 & Select Tech & Energy & \multicolumn{1}{|c|}{ Utilities } & Real Estate & Banking & 30000 & \\ \hline Allocation 2 & 10000 & 5000 & 0 & 5000 & 10000 & 35000 & \\ Allocation 3 & 10000 & 5000 & 5000 & 5000 & 10000 & 30000 & \\ \hline \end{tabular} Questions: 1. How risky is portfolio 1 relative to the S\&P 500 ? More? Less? By how much? 2. What does the introduction of the Utilities fund do to the portfolio beta? Why? 3. What does the dropping of the Energy fund do to the portolio beta? Why? Recall from HM2 you calculated the volatilities of each price series. Recreate that here. Next, calculate the variance of returns (volatilities) for each price series. Next, calculate the covariance of returns between each series and corn. Using the variances and covariances, calculate the betas of wheat, cotton, and peanuts relative to corn. Prices Annual Volatilities
Step by Step Solution
There are 3 Steps involved in it

Get step-by-step solutions from verified subject matter experts