

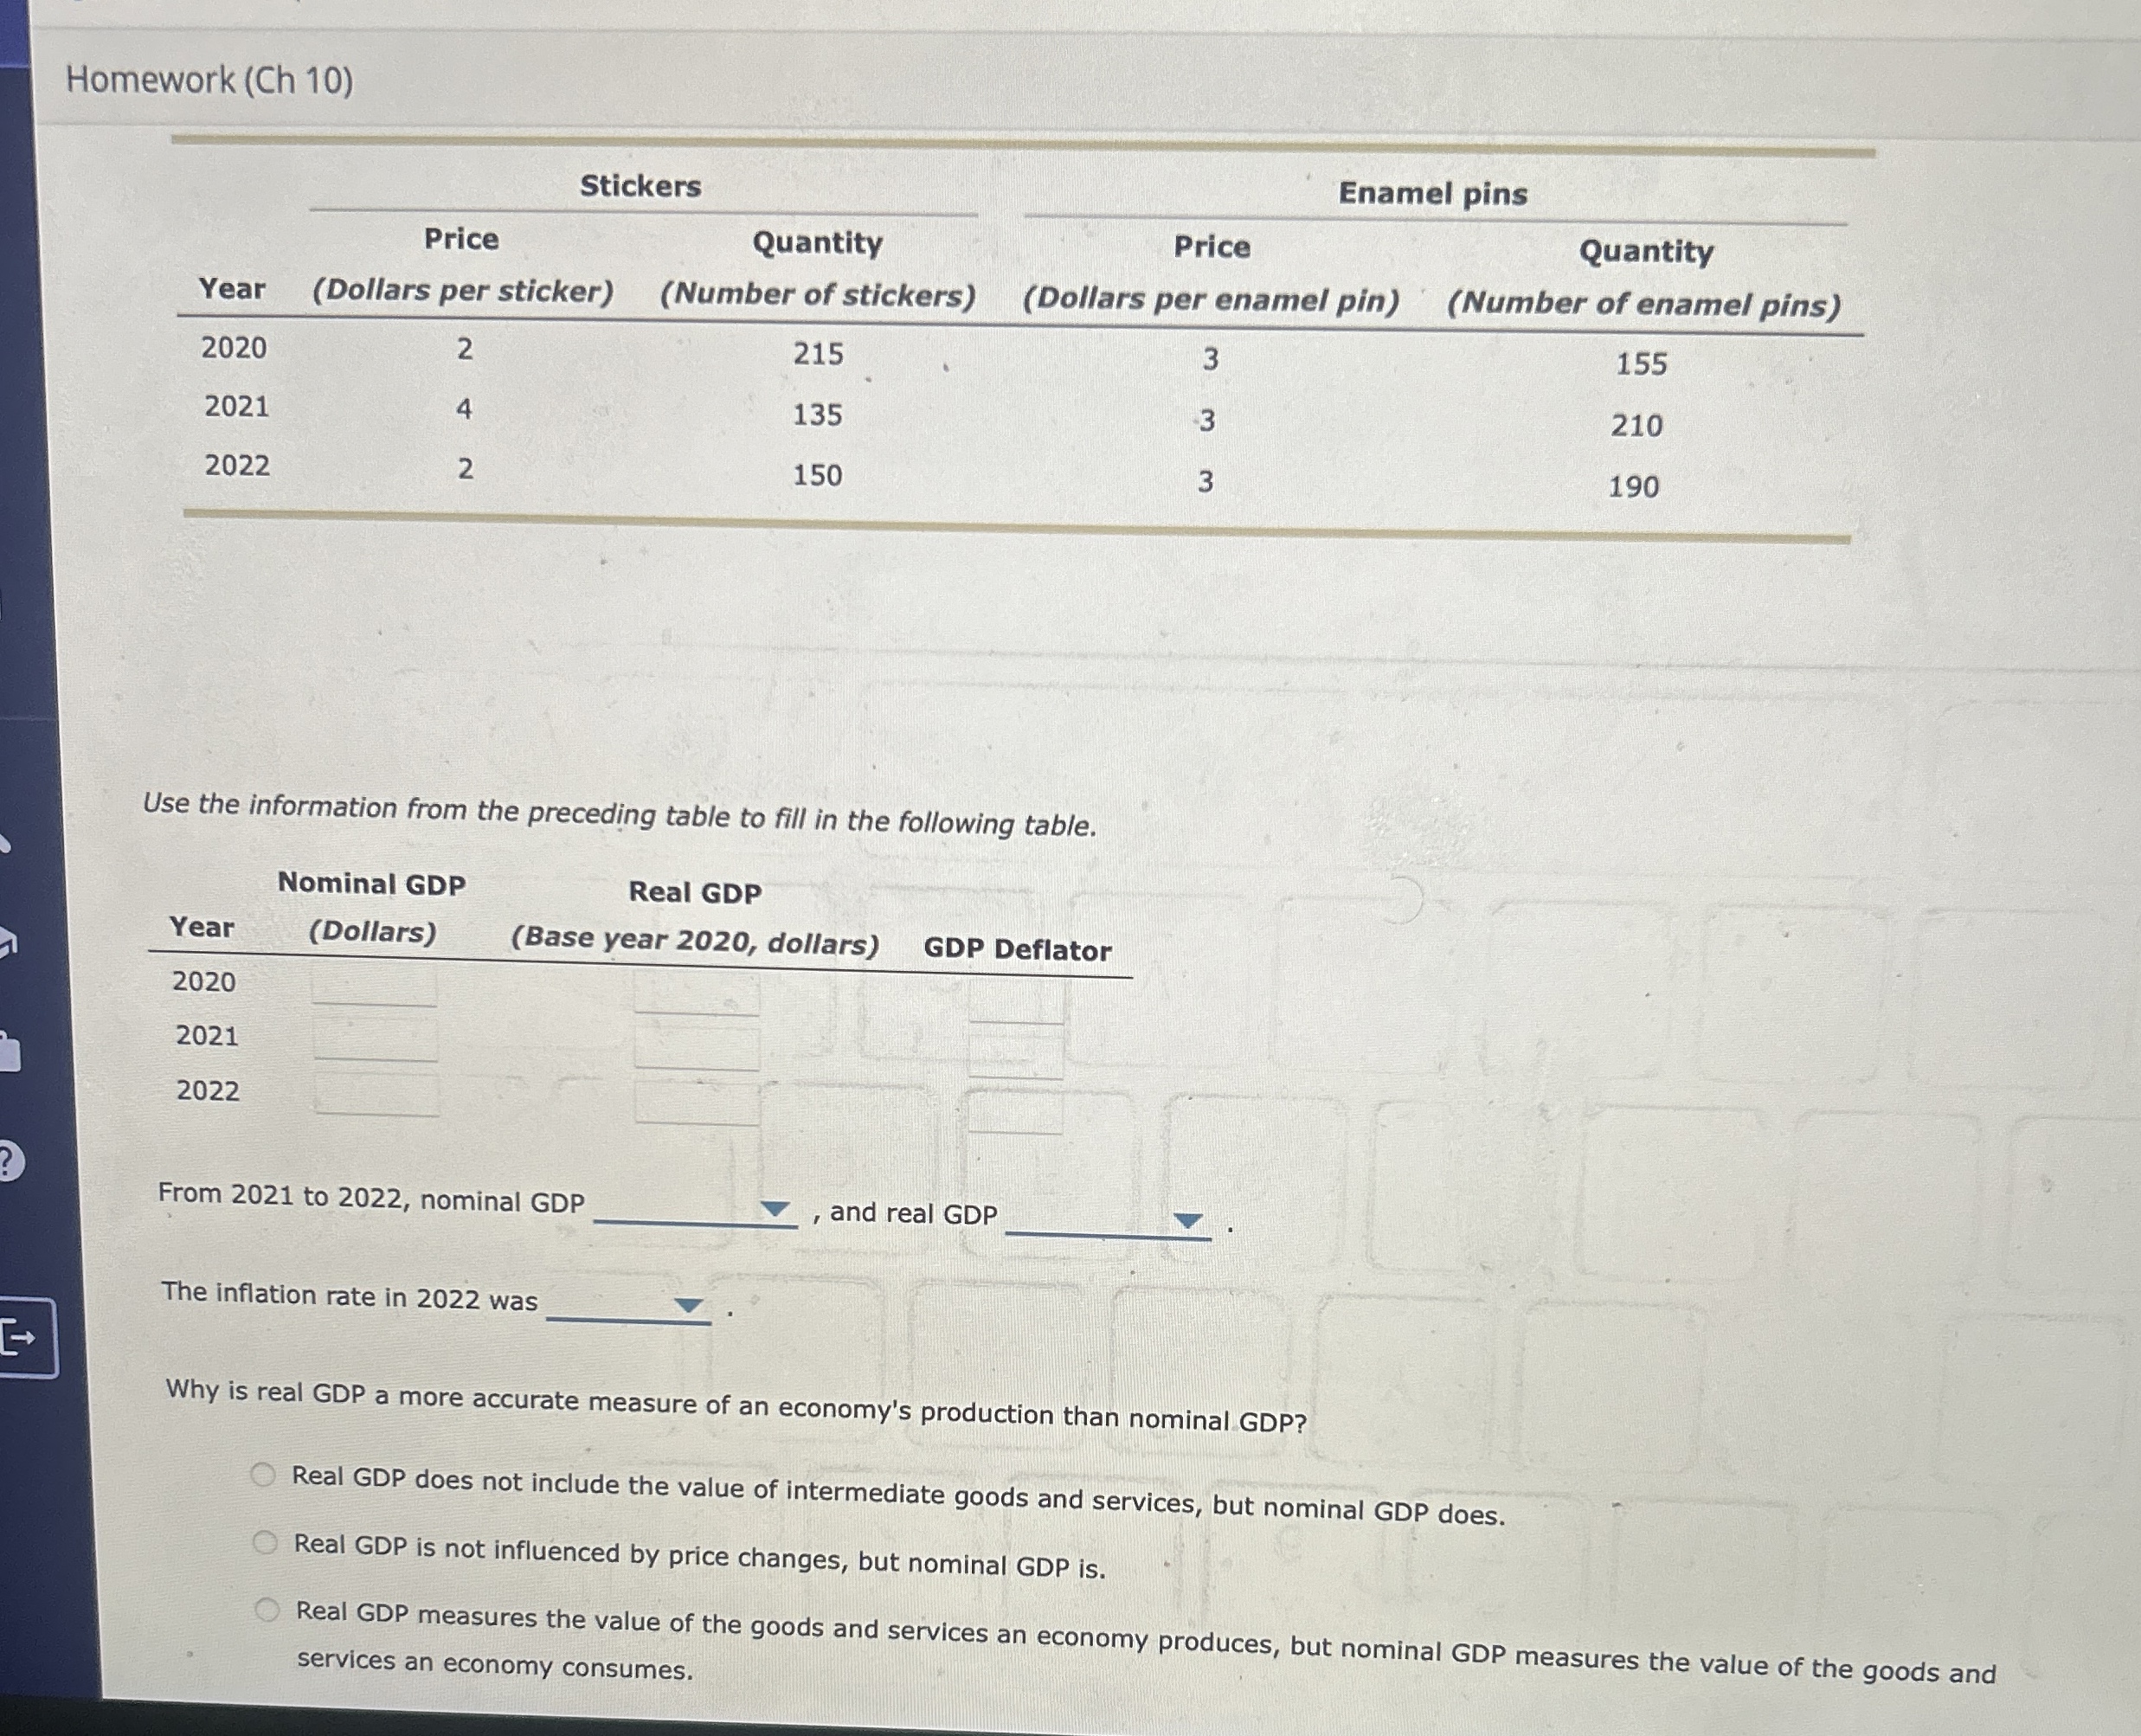
Question: Homework ( Ch 1 0 ) table [ [ Year , Stickers,Enamel pins ] , [ table [ [ Price ] , [
Homework Ch
tableYearStickers,Enamel pinstablePriceDollars per stickertableQuantityNumber of stickerstablePriceDollars per enamel pintableQuantityNumber of enamel pins
Use the information from the preceding table to fill in the following table.
tabletableNominal GDPDollarstableReal GDPYearBase year dollars
From to nominal GDP and real GDP
The inflation rate in was
Why is real GDP a more accurate measure of an economy's production than nominal GDP
Real GDP does not include the value of intermediate goods and services, but nominal GDP does.
Real GDP is not influenced by price changes, but nominal GDP is
Real GDP measures the value of the goods and services an economy produces, but nominal GDP measures the value of the goods and services an economy consumes.
Step by Step Solution
There are 3 Steps involved in it
1 Expert Approved Answer
Step: 1 Unlock

Question Has Been Solved by an Expert!
Get step-by-step solutions from verified subject matter experts
Step: 2 Unlock
Step: 3 Unlock