

Question: Homework: E Question 1, 10.1.21-T Week 8 HW Score: 74.03%, 10.36 of 14 points Part 2 of 7 Score: 0.36 of 4 Save Homework The
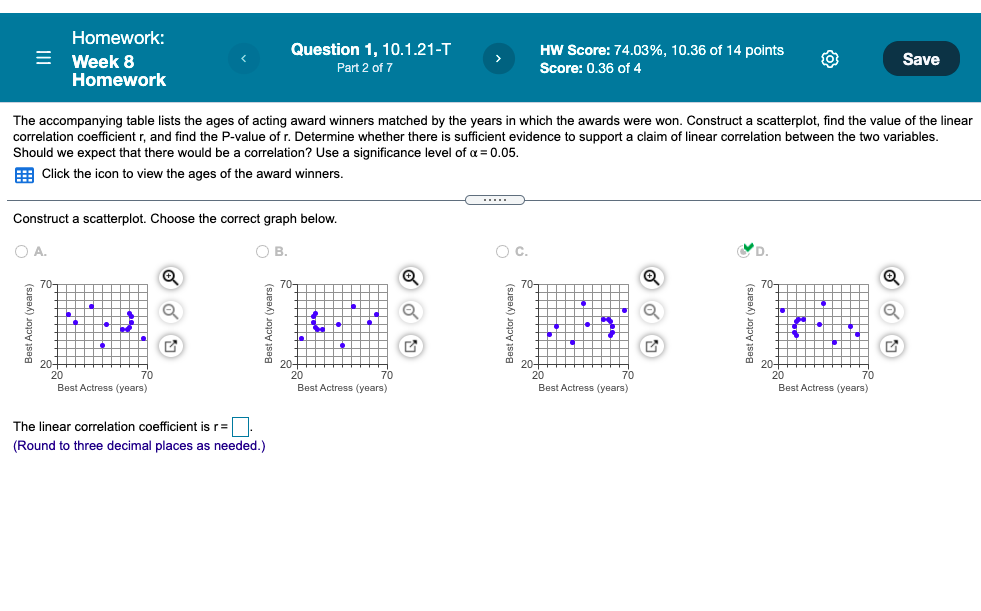
Homework: E Question 1, 10.1.21-T Week 8 HW Score: 74.03%, 10.36 of 14 points Part 2 of 7 Score: 0.36 of 4 Save Homework The accompanying table lists the ages of acting award winners matched by the years in which the awards were won. Construct a scatterplot, find the value of the linear correlation coefficient r, and find the P-value of r. Determine whether there is sufficient evidence to support a claim of linear correlation between the two variables. Should we expect that there would be a correlation? Use a significance level of a = 0.05. Click the icon to view the ages of the award winners. Construct a scatterplot. Choose the correct graph below. O A. OB. O C. D. 70 707 70T 70T Best Actor (years) Best Actor (years) Best Actor (years) Best Actor (years) 20- 20 20- 20- 20 20 70 20 20 Best Actress (years) Best Actress (years) Best Actress (years) Best Actress (years) The linear correlation coefficient is r=. (Round to three decimal places as needed.)
Step by Step Solution
There are 3 Steps involved in it

Get step-by-step solutions from verified subject matter experts