

Question: Homework: E Question 1, 10.1.21-T Week 8 HW Score: 74.03%, 10.36 of 14 points Part 2 of 7 Score: 0.36 of 4 Save Homework The

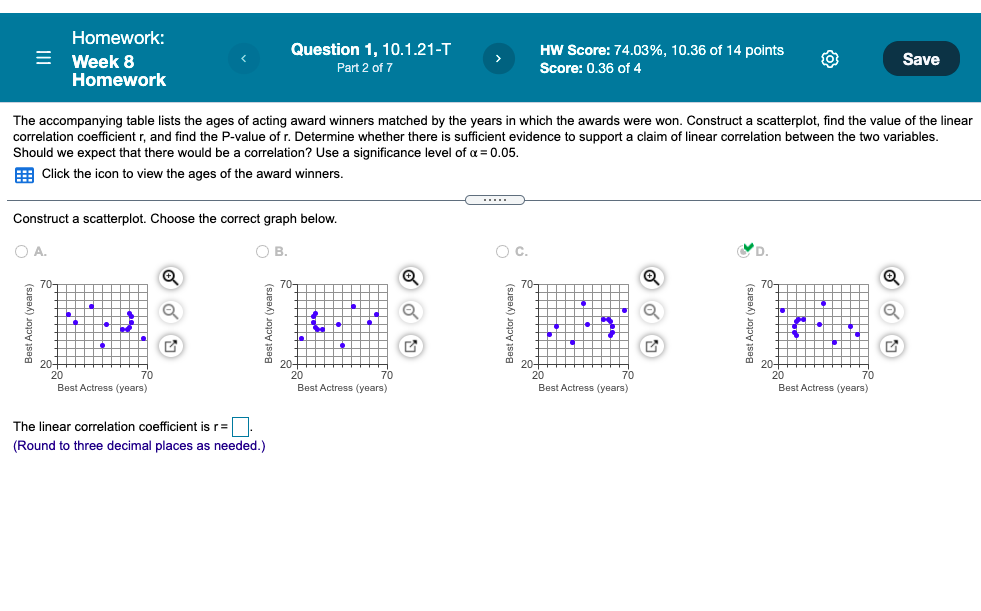
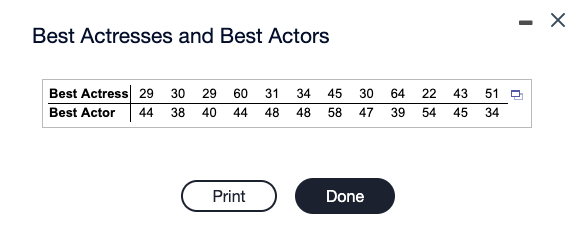
Homework: E Question 1, 10.1.21-T Week 8 HW Score: 74.03%, 10.36 of 14 points Part 2 of 7 Score: 0.36 of 4 Save Homework The accompanying table lists the ages of acting award winners matched by the years in which the awards were won. Construct a scatterplot, find the value of the linear correlation coefficient r, and find the P-value of r. Determine whether there is sufficient evidence to support a claim of linear correlation between the two variables. Should we expect that there would be a correlation? Use a significance level of a = 0.05. Click the icon to view the ages of the award winners. Construct a scatterplot. Choose the correct graph below. O A. OB. O C. D. 70 707 70T 70T Best Actor (years) Best Actor (years) Best Actor (years) Best Actor (years) 20- 20 20- 20- 20 20 70 20 20 Best Actress (years) Best Actress (years) Best Actress (years) Best Actress (years) The linear correlation coefficient is r=. (Round to three decimal places as needed.)X Best Actresses and Best Actors Best Actress 29 30 29 60 31 34 45 30 64 22 43 51 Best Actor 44 38 40 44 48 48 58 47 39 54 45 34 Print Done
Step by Step Solution
There are 3 Steps involved in it

Get step-by-step solutions from verified subject matter experts