

Question: Homework for Chapter 14: Problem #1 in the text (Chapter 14) NOTE: PLEASE USE THE ATTACHED EXCEL FILE TITLED Homework for Chapter 14_Excel TO SOLVE
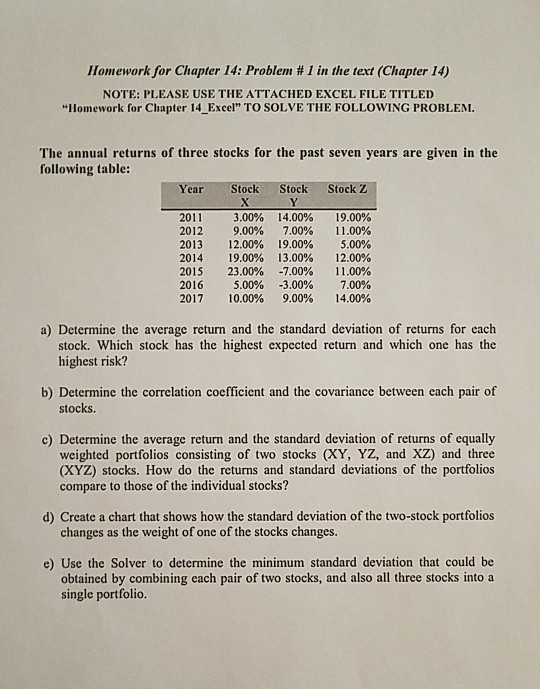
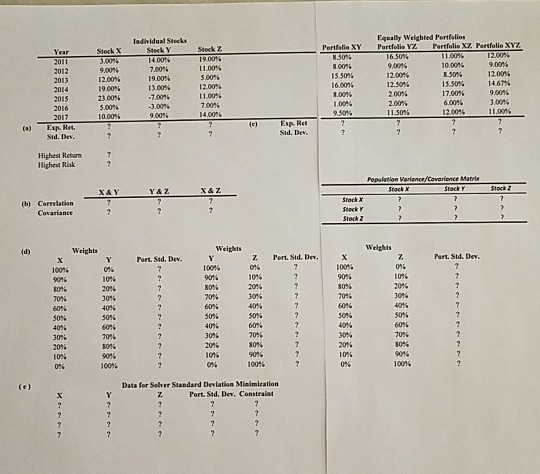
Homework for Chapter 14: Problem #1 in the text (Chapter 14) NOTE: PLEASE USE THE ATTACHED EXCEL FILE TITLED "Homework for Chapter 14_Excel" TO SOLVE THE FOLLOWING PROBLEM. The annual returns of three stocks for the past seven years are given in the following table: Year Stock Stock Stock Z X Y 2011 3.00% 14.00% 19.00% 2012 9.00% 7.00% 11.00% 2013 12.00% 19.00% 5.00% 2014 19.00% 13.00% 12.00% 2015 23.00% -7.00% 11.00% 2016 5.00% -3.00% 7.00% 2017 10.00% 9.00% 14.00% a) Determine the average return and the standard deviation of returns for each stock. Which stock has the highest expected return and which one has the highest risk? b) Determine the correlation coefficient and the covariance between each pair of stocks. c) Determine the average return and the standard deviation of returns of equally weighted portfolios consisting of two stocks (XY, YZ, and XZ) and three (XYZ) stocks. How do the returns and standard deviations of the portfolios compare to those of the individual stocks? d) Create a chart that shows how the standard deviation of the two-stock portfolios changes as the weight of one of the stocks changes. e) Use the Solver to determine the minimum standard deviation that could be obtained by combining each pair of two stocks, and also all three stocks into a single portfolio. Indha Stocks Sterk Stockz Portfolio Xy Portfolio XYZ 11.00% 5.0096 36016 15.5096 Equally Weighted Portfolio Portfele Portfolio 1606 9006 10006 12.0096 3.50% 12.5096 15 506 2006 17.0096 2006 9.00 12.00% 12.00% 19.00% 19.00: 13.00% Bons 1.00% SO 11 00 7.005 14 - JAG 2017 Eup. Het (a) Highest Retur Highest Risk (b) Currelation Cuvariance Weights Welights Weights 100 SORG 8096 7096 7046 7016 06 S06 5016 50% 40116 50% 6096 6076 4046 309 7016 3095 2015 7045 20% 3046 1096 10046 10096 Data for Sohrer Standard Delation Minimization Port. Sid. Dev, Constraint
Step by Step Solution
There are 3 Steps involved in it

Get step-by-step solutions from verified subject matter experts