

Question: homework help Table Tools q1 dat565 - Microsoft Word ew View Design Layout One Page View Side by Side Two Pages Synchronous Scrolling New Arrange
homework help
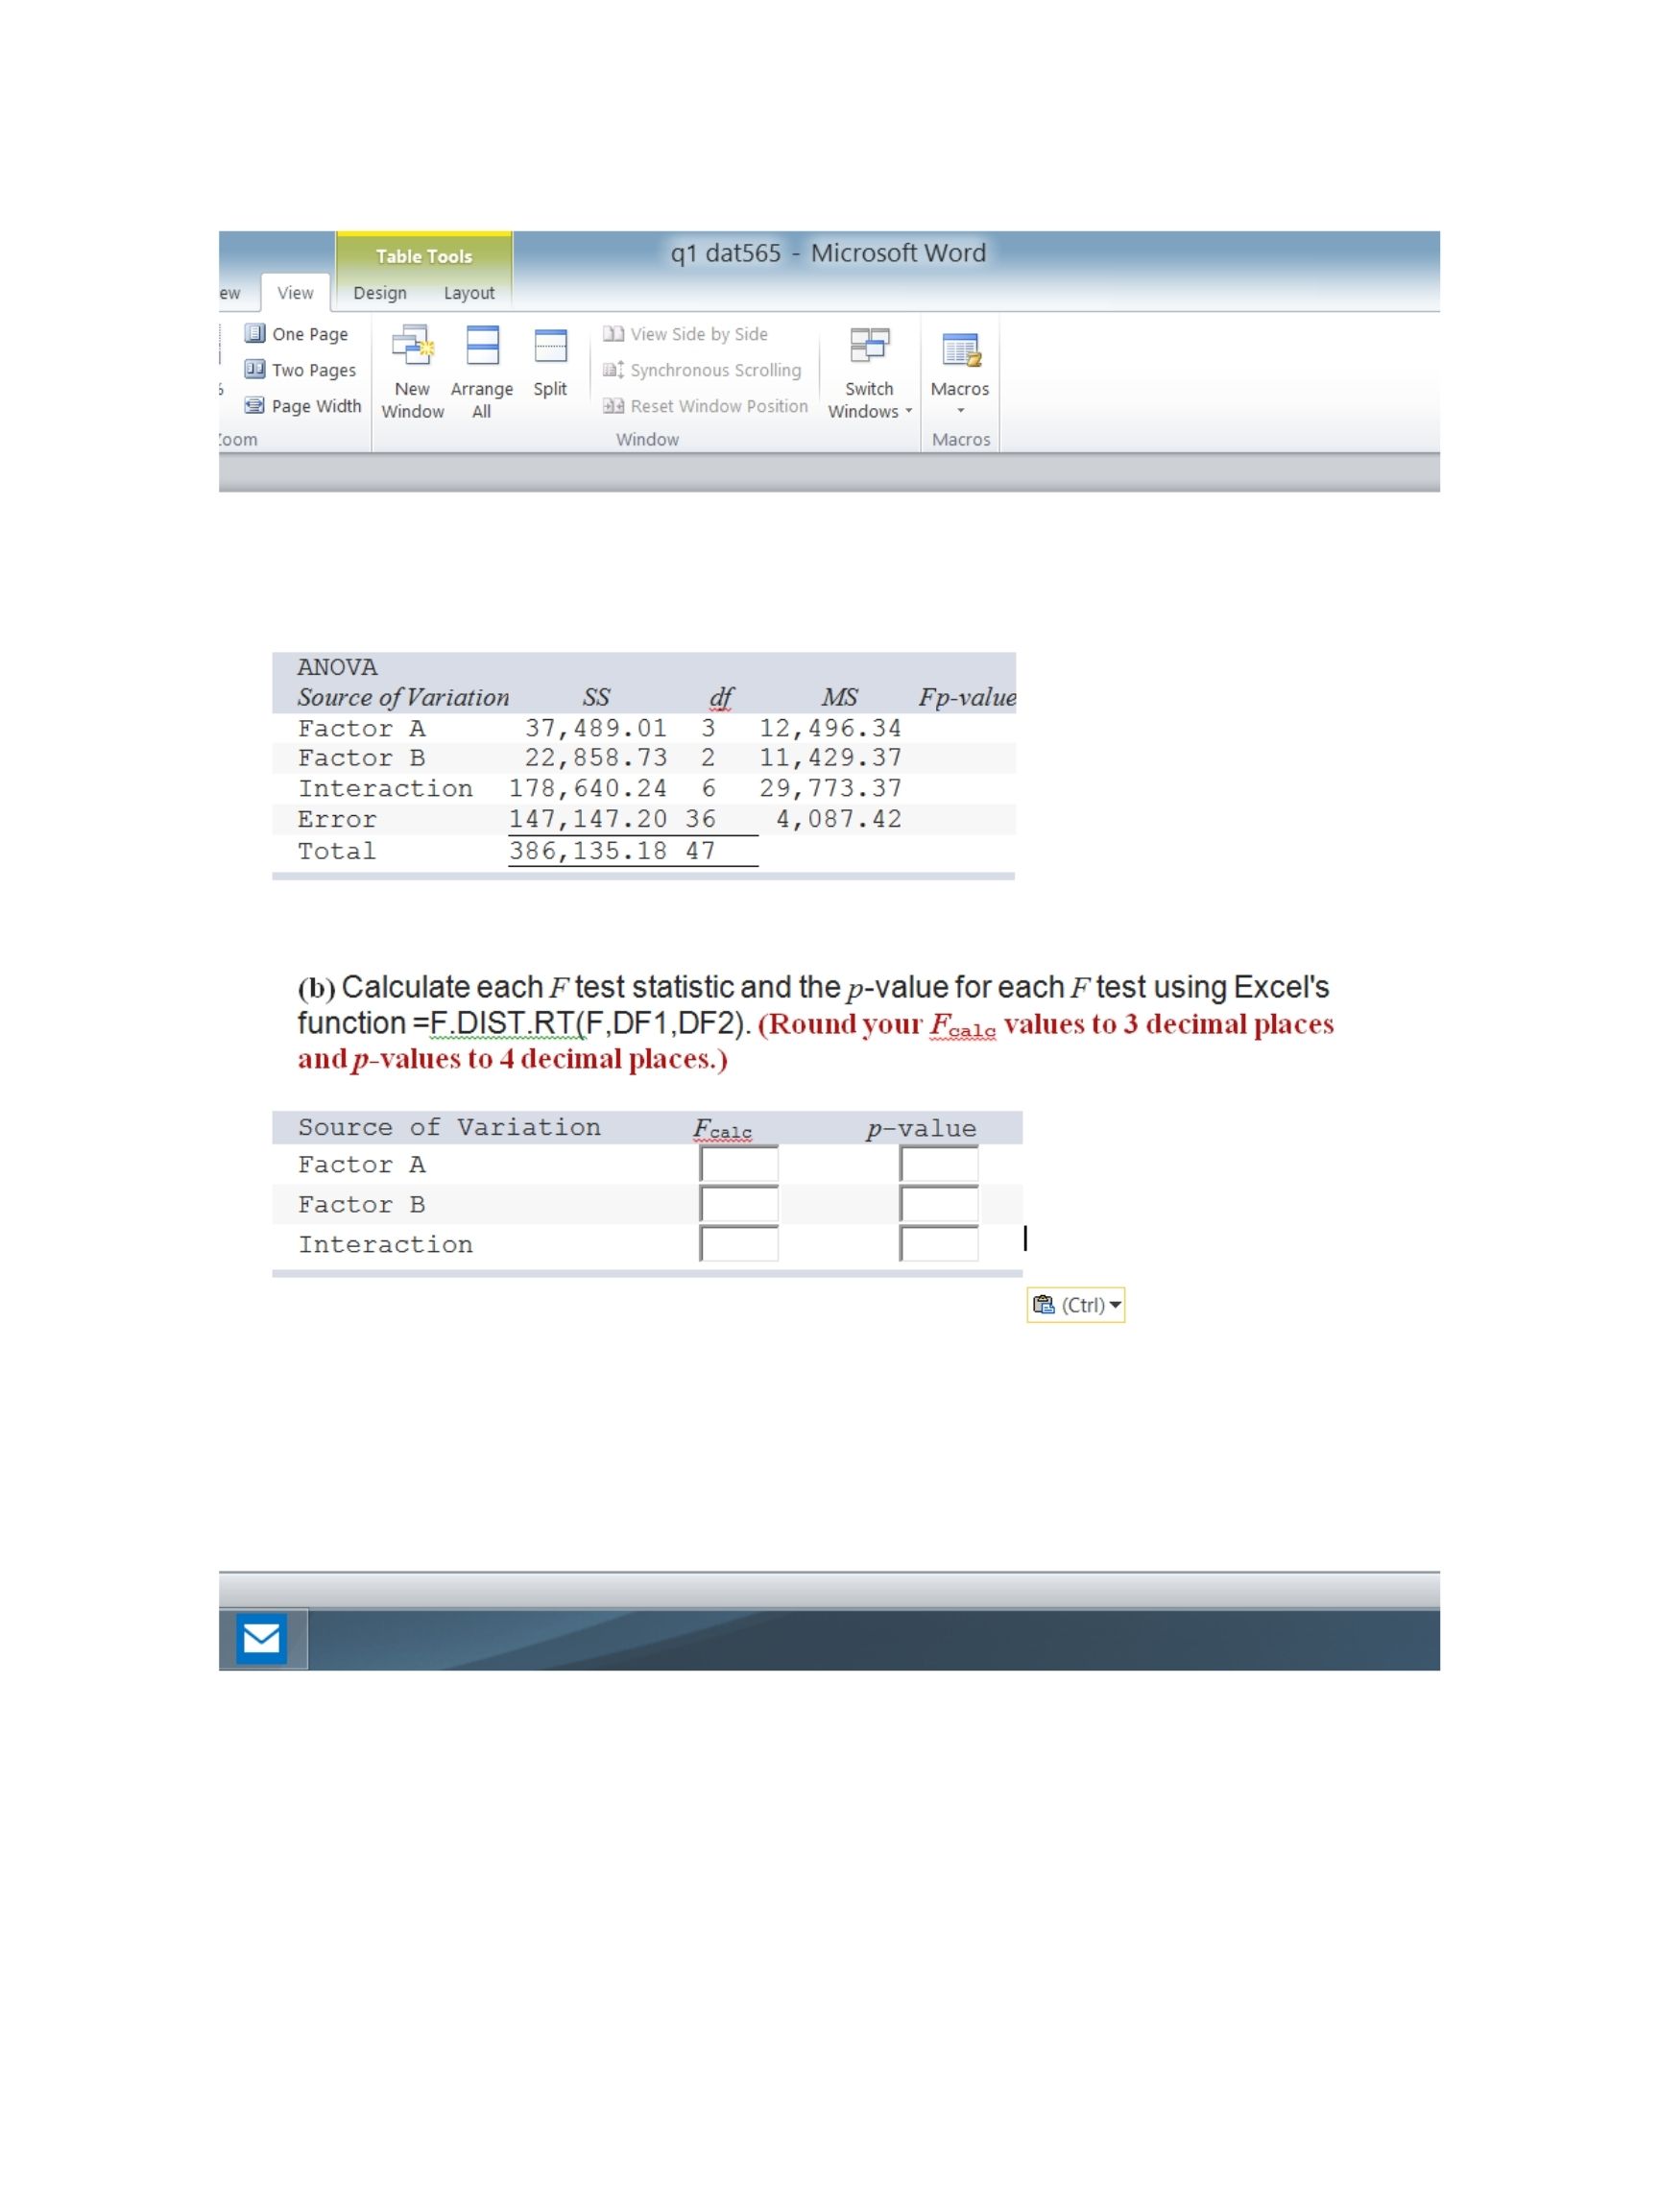
Table Tools q1 dat565 - Microsoft Word ew View Design Layout One Page View Side by Side Two Pages Synchronous Scrolling New Arrange Split Switch Macros Page Width Window All Reset Window Position Windows oom Window Macros ANOVA Source of Variation SS df MS Fp-value Factor A 37, 489. 01 3 12, 496. 34 Factor B 22, 858 . 73 2 11, 429.37 Interaction 178 , 640. 24 6 29 , 773.37 Error 147, 147 . 20 36 4, 087 . 42 Total 386, 135 . 18 47 (b) Calculate each F test statistic and the p-value for each F test using Excel's function =F.DIST.RT(F,DF1,DF2). (Round your Fears values to 3 decimal places and p-values to 4 decimal places.) Source of Variation Fcalc p-value Factor A Factor B Interaction 2 (Ctrl)
Step by Step Solution
There are 3 Steps involved in it

Get step-by-step solutions from verified subject matter experts