

Question: homework help. You/ll have to use Excel . This is all the data given to me Table Tools q1 dat565 - Microsoft Word References Mailings
homework help. You/ll have to use Excel . This is all the data given to me
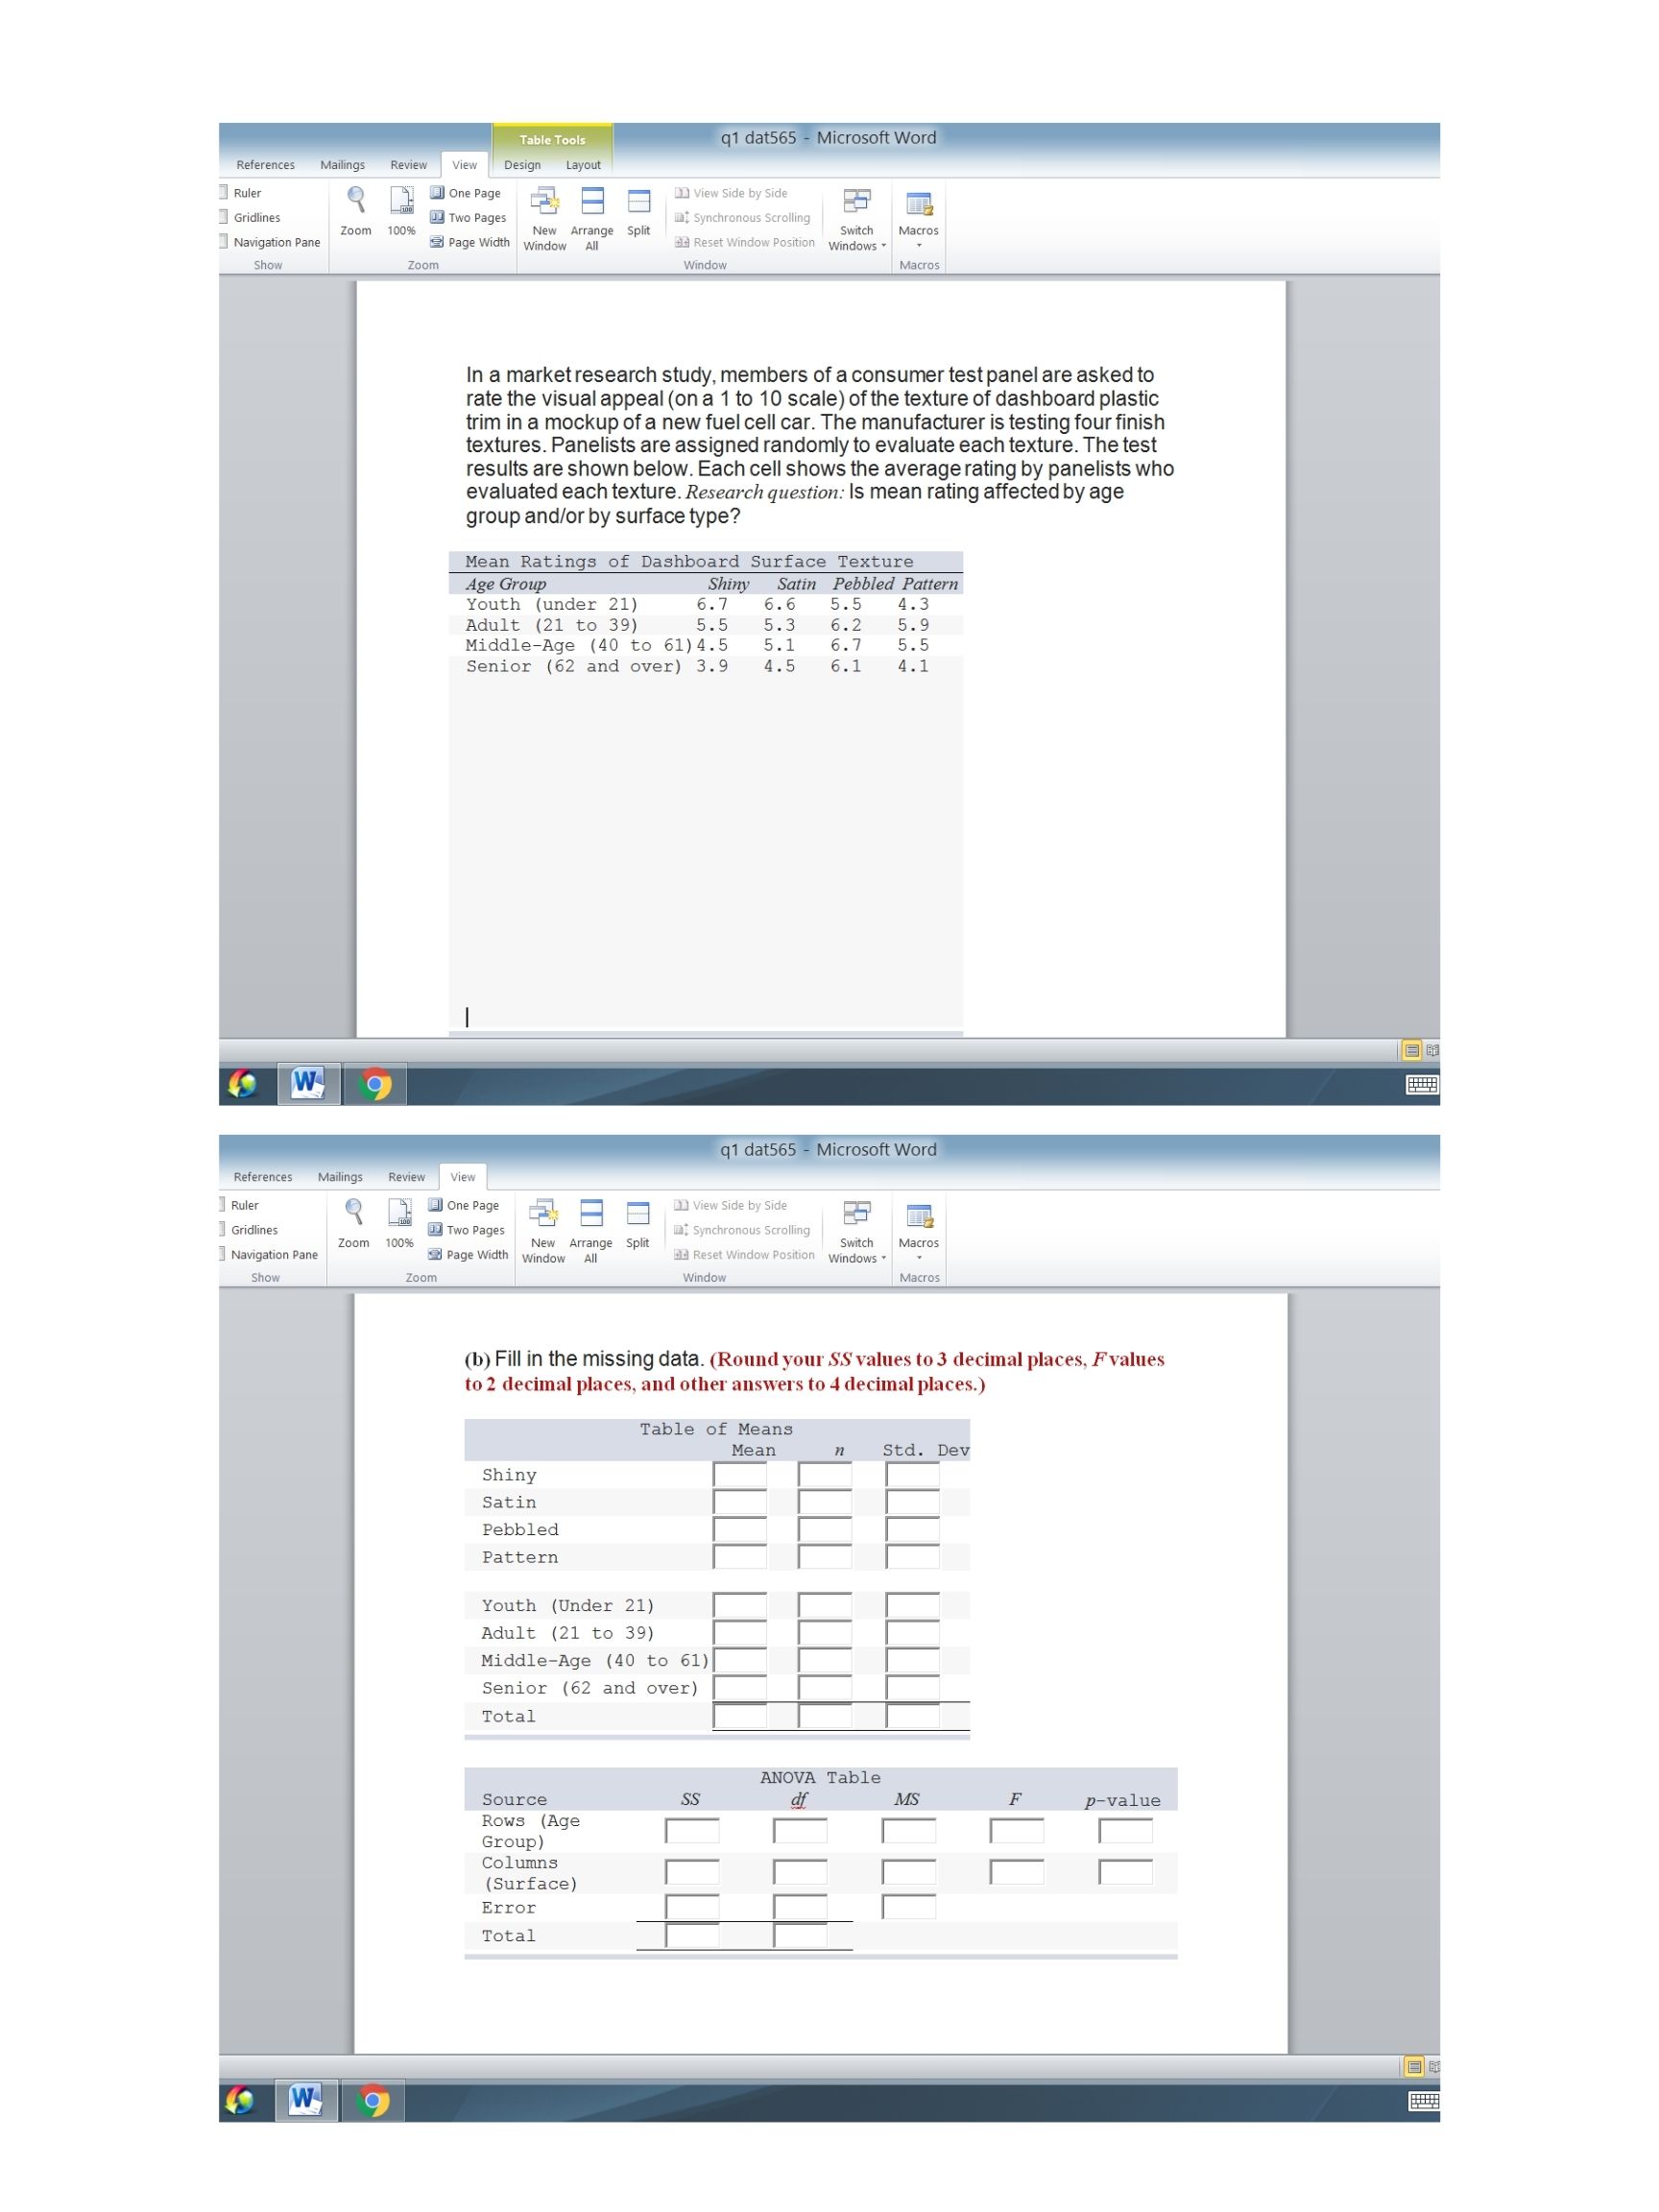
Table Tools q1 dat565 - Microsoft Word References Mailings Review View Design Layout Ruler one Page DD View Side by Side Gridlines Two Pages mat Synchronous Scrolling Switch Macros Navigation Pane New Arrange Split Zoom 100% Page Width Window All Reset Window Position Windows Show Zoom Window Macros In a market research study, members of a consumer test panel are asked to rate the visual appeal (on a 1 to 10 scale) of the texture of dashboard plastic trim in a mockup of a new fuel cell car. The manufacturer is testing four finish textures. Panelists are assigned randomly to evaluate each texture. The test results are shown below. Each cell shows the average rating by panelists who evaluated each texture. Research question: Is mean rating affected by age group and/or by surface type? Mean Ratings of Dashboard Surface Texture Age Group Shiny Satin Pebbled Pattern Youth (under 21) 6.7 6.6 5.5 4.3 Adult (21 to 39) 5.5 5.3 6.2 5.9 Middle-Age (40 to 61) 4.5 5.1 6.7 5 .5 Senior (62 and over) 3.9 4.5 6.1 4.1 W 9 q1 dat565 - Microsoft Word References Mailings Review View 1Ruler one Page Da View Side by Side Gridlines Two Pages at Synchronous Scrolling Zoom 100% Page Width Window New Switch MacrosNavigation Pane w Arrange Split Ha Reset Window Position Windows Show Zoom Window Macros (b) Fill in the missing data. (Round your SS values to 3 decimal places, Fvalues to 2 decimal places, and other answers to 4 decimal places.) Table of Means Mean n Std. Dev Shiny Satin Pebbled Pattern Youth (Under 21) Adult (21 to 39) Middle-Age (40 to 61 Senior (62 and over) Total ANOVA Table Source SS Rows (Age Group) Columns (Surface) Error Total ( W 9
Step by Step Solution
There are 3 Steps involved in it

Get step-by-step solutions from verified subject matter experts