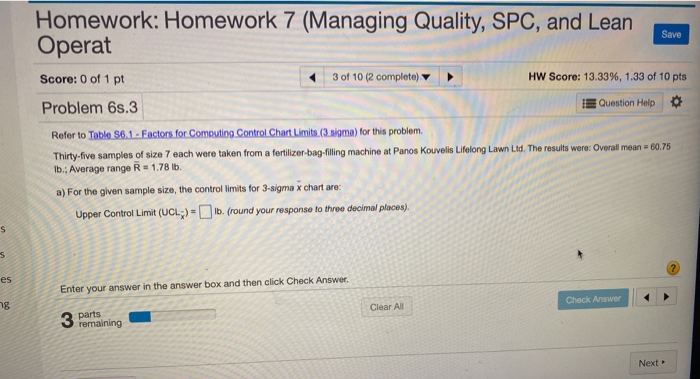
Question: Homework: Homework 7 (Managing Quality, SPC, and Lean Operat Save Score: 0 of 1 pt 3 of 10 (2 complete) HW Score: 13.33%, 1.33 of

Homework: Homework 7 (Managing Quality, SPC, and
Homework: Homework 7 (Managing Quality, SPC, and Lean Operat Save Score: 0 of 1 pt 3 of 10 (2 complete) HW Score: 13.33%, 1.33 of 10 pts Problem 68.3 Question Help Refer to Table 56.1. Factors for Computing Control Chart Limits (3 sma) for this problem Thirty-five samples of size 7 each were taken from a fertilizer-bag-filing machine at Panos Kouvelis Lifelong Lawn Lid. The results were: Overall mean = 60.75 ib. Average range R = 1.78 lb. a) For the given sample size, the control limits for 3-sigma x chart are: Upper Control Limit (UCL;) - b. (round your response to three decimal places). 000 Enter your answer in the answer box and then click Check Answer Check Answer Clear All 3 Pemaining

Step by Step Solution

There are 3 Steps involved in it

1 Expert Approved Answer
Step: 1 Unlock blur-text-image
Question Has Been Solved by an Expert!

Get step-by-step solutions from verified subject matter experts

Step: 2 Unlock
Step: 3 Unlock

Students Have Also Explored These Related General Management Questions!