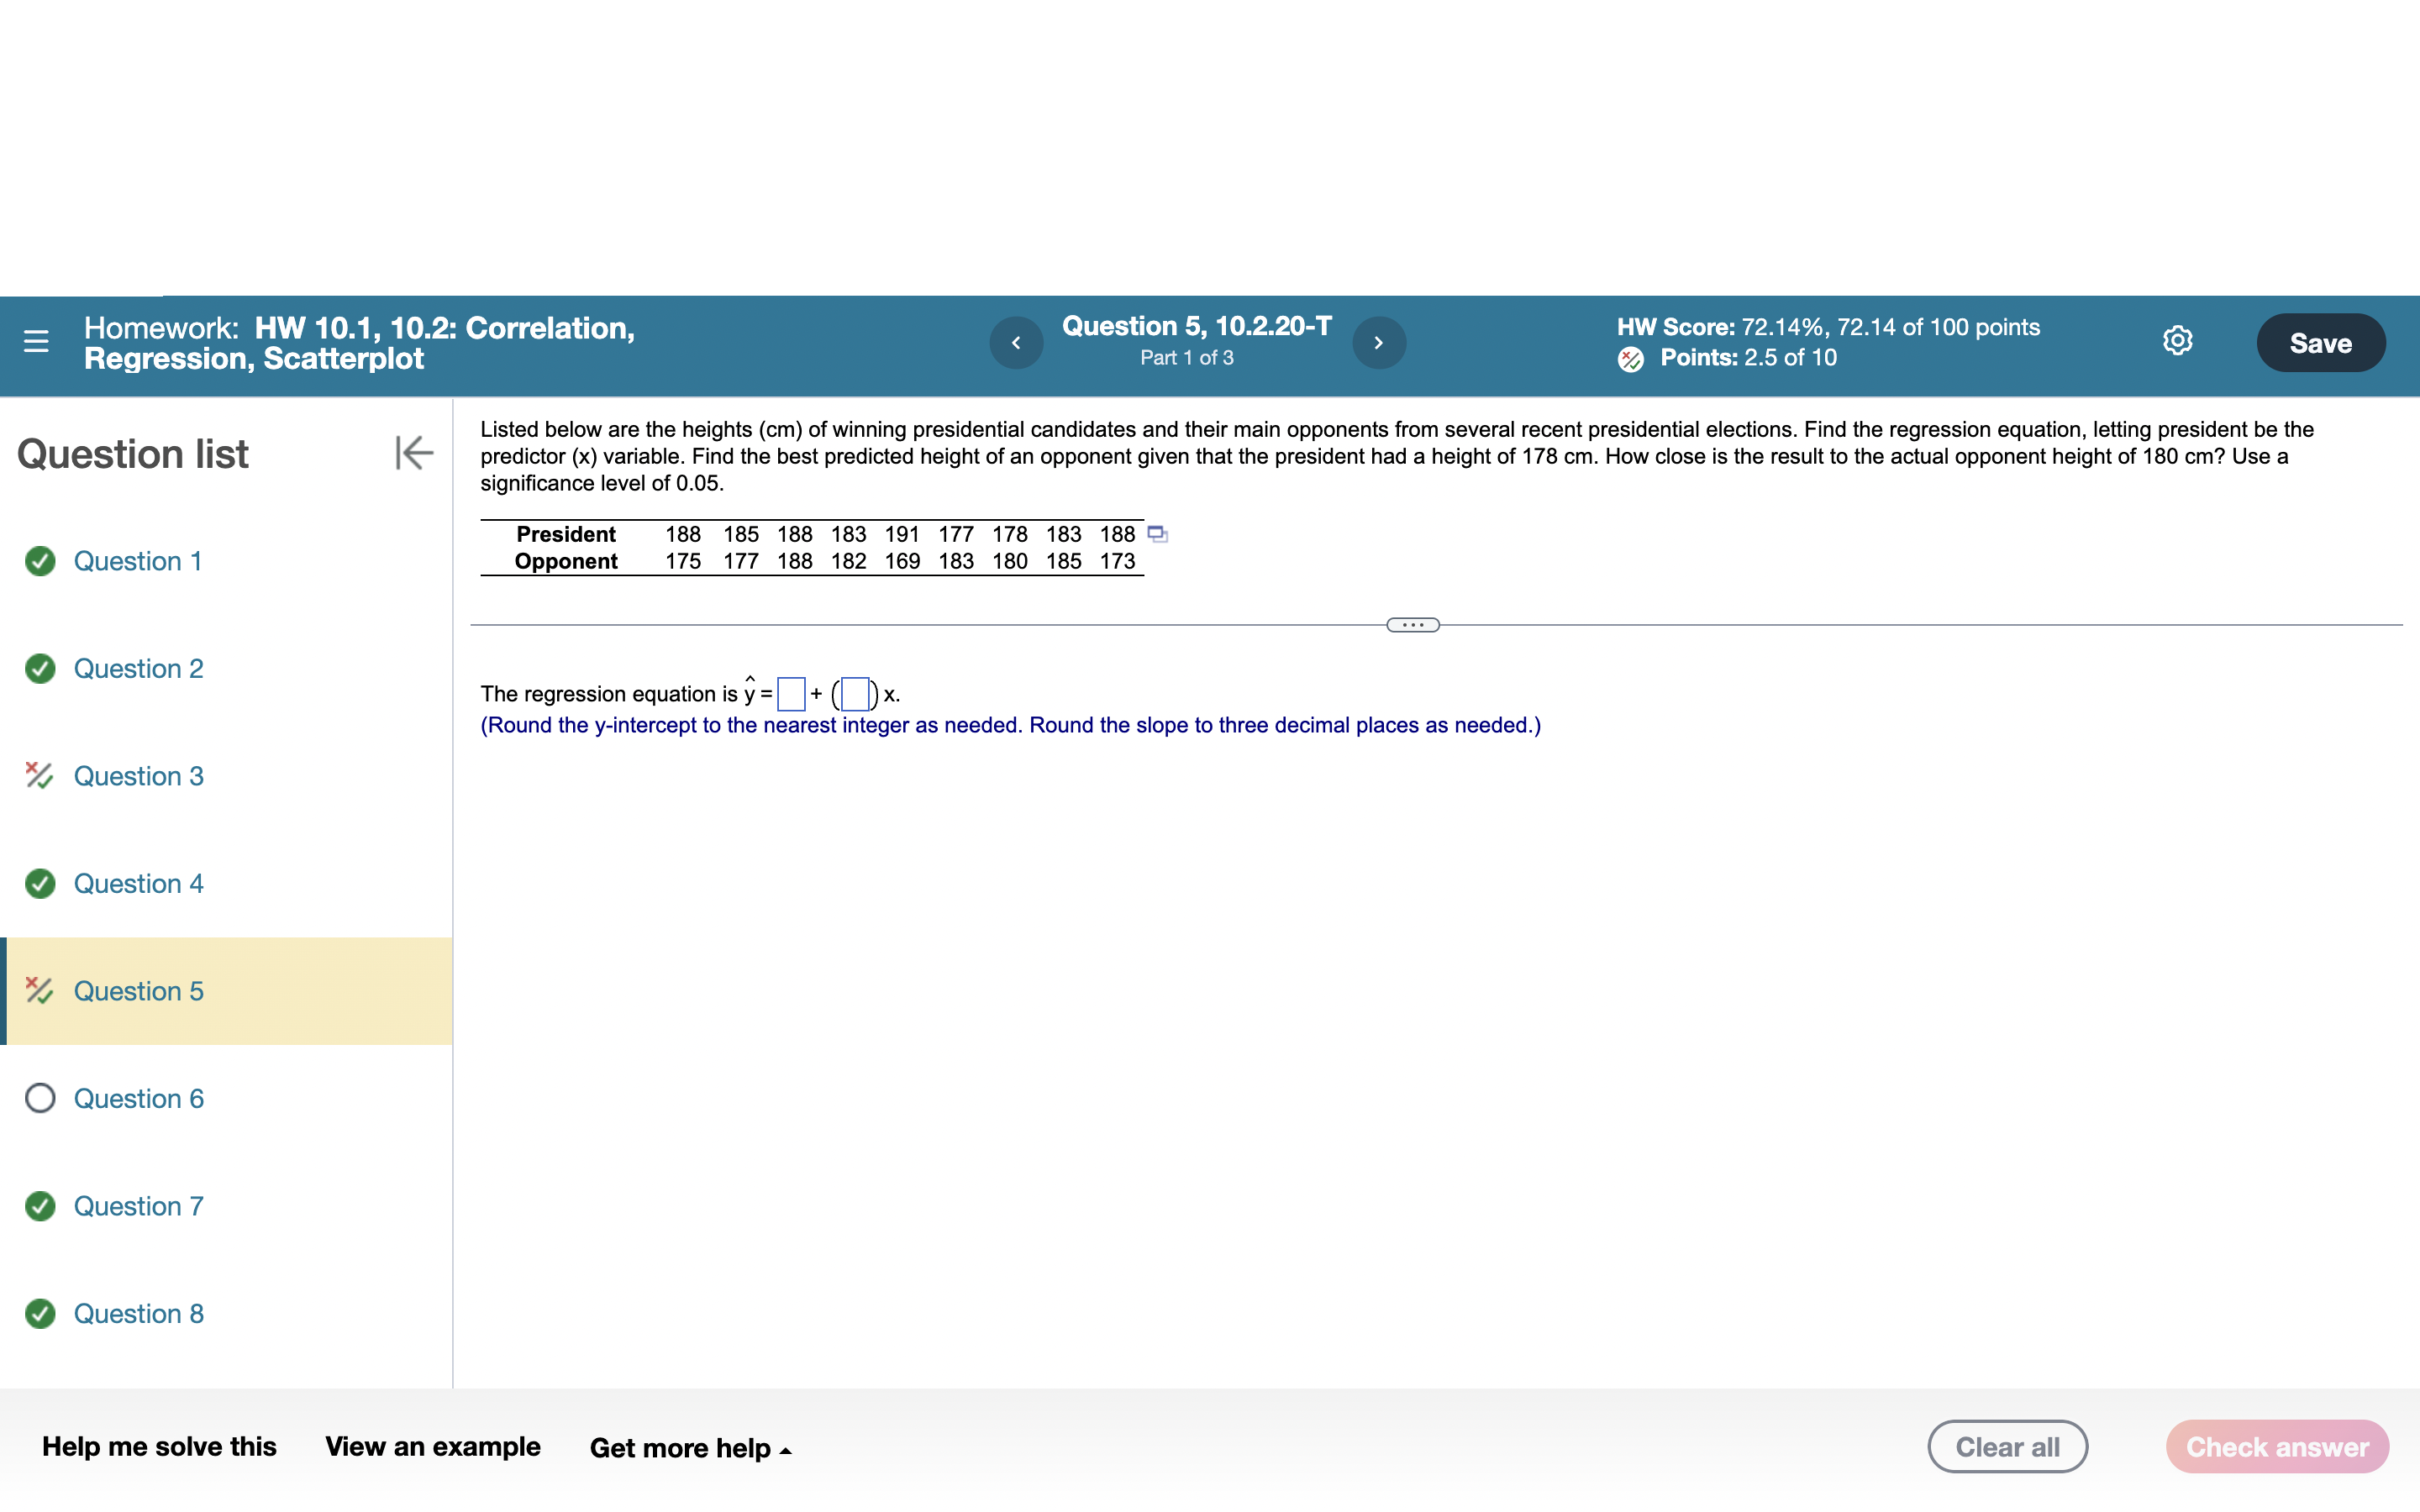
Question: Homework: HW 10.1, 10.2: Correlation, . Question 5, 10.2.20-T N HW Score: 72.14%, 72.14 of 100 points Regression, Scatterplot Part 1 of 3 @ Points:

Homework: HW 10.1, 10.2: Correlation, . Question
Homework: HW 10.1, 10.2: Correlation, . Question 5, 10.2.20-T N HW Score: 72.14%, 72.14 of 100 points Regression, Scatterplot Part 1 of 3 @ Points: 2.5 of 10 . . Listed below are the heights (cm) of winning presidential candidates and their main opponents from several recent presidential elections. Find the regression equation, letting president be the Questlon ||st | predictor (x) variable. Find the best predicted height of an opponent given that the president had a height of 178 cm. How close is the result to the actual opponent height of 180 cm? Use a significance level of 0.05. President 188 185 188 183 191 177 178 183 188 T o Question 1 Opponent 175 177 188 182 169 183 180 185 173 @ Question 2 The regression equation is ; = |+ X. (Round the y-intercept to the nearest integer as needed. Round the slope to three decimal places as needed.) %, Question 3 @ Question 4 % Question 5 O Question 6 @ Question 7 @ Question 8 Help me solve this View an example Get more help ~

Step by Step Solution

There are 3 Steps involved in it

1 Expert Approved Answer
Step: 1 Unlock blur-text-image
Question Has Been Solved by an Expert!

Get step-by-step solutions from verified subject matter experts

Step: 2 Unlock
Step: 3 Unlock

Students Have Also Explored These Related Law Questions!