Question: Homework: M2 = Assignment 1: Attribute SPC Day 1 2 3 4 5 Aides Absent 9 5 As a hospital administrator of a large hospital,
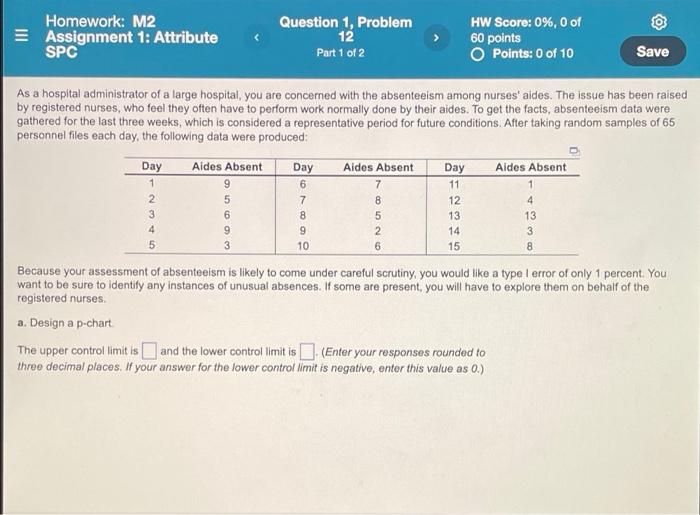
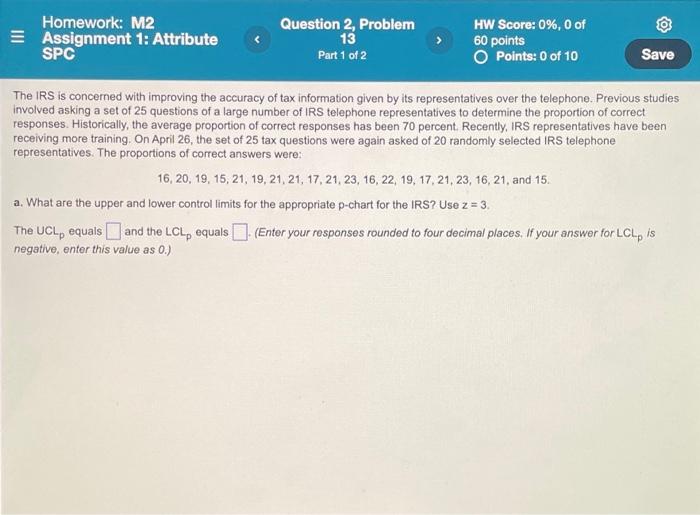
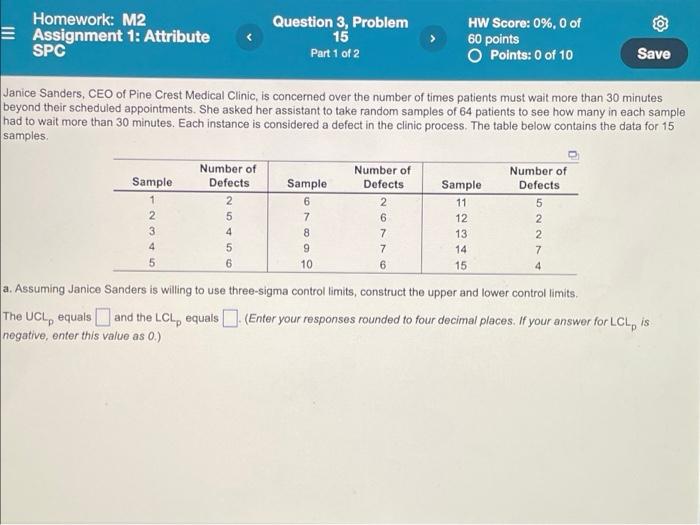
Homework: M2 = Assignment 1: Attribute SPC Day 1 2 3 4 5 Aides Absent 9 5 As a hospital administrator of a large hospital, you are concerned with the absenteeism among nurses' aides. The issue has been raised by registered nurses, who feel they often have to perform work normally done by their aides. To get the facts, absenteeism data were gathered for the last three weeks, which is considered a representative period for future conditions. After taking random samples of 65 personnel files each day, the following data were produced: 6 Question 1, Problem 12 Part 1 of 2 9 3 Day 6 7 8 9 10 Aides Absent 7 8 5 2 6 HW Score: 0%, 0 of 60 points O Points: 0 of 10 Day 11 12 13 14 15 Save Aides Absent 1 4 13 3 8 Because your assessment of absenteeism is likely to come under careful scrutiny, you would like a type I error of only 1 percent. You want to be sure to identify any instances of unusual absences. If some are present, you will have to explore them on behalf of the registered nurses. a. Design a p-chart. The upper control limit is and the lower control limit is (Enter your responses rounded to three decimal places. If your answer for the lower control limit is negative, enter this value as 0.) Homework: M2 = Assignment 1: Attribute SPC Question 2, Problem 13 Part 1 of 2 HW Score: 0%, 0 of 60 points O Points: 0 of 10 The IRS is concerned with improving the accuracy of tax information given by its representatives over the telephone. Previous studies involved asking a set of 25 questions of a large number of IRS telephone representatives to determine the proportion of correct responses. Historically, the average proportion of correct responses has been 70 percent. Recently, IRS representatives have been receiving more training. On April 26, the set of 25 tax questions were again asked of 20 randomly selected IRS telephone representatives. The proportions of correct answers were: 16, 20, 19, 15, 21, 19, 21, 21, 17, 21, 23, 16, 22, 19, 17, 21, 23, 16, 21, and 15. Save a. What are the upper and lower control limits for the appropriate p-chart for the IRS? Use z = 3. The UCL, equals and the LCL, equals (Enter your responses rounded to four decimal places. If your answer for LCLp is negative, enter this value as 0.) Homework: M2 Assignment 1: Attribute SPC Sample 1 2 4 5 Janice Sanders, CEO of Pine Crest Medical Clinic, is concerned over the number of times patients must wait more than 30 minutes beyond their scheduled appointments. She asked her assistant to take random samples of 64 patients to see how many in each sample had to wait more than 30 minutes. Each instance is considered a defect in the clinic process. The table below contains the data for 15 samples. Number of Defects Question 3, Problem 15 Part 1 of 2 2 5 4 5 6 Sample 6 7 8 9 10 Number of Defects 2 6 HW Score: 0%, 0 of 60 points O Points: 0 of 10 7 7 6 Sample 11 12 13 14 15 Number of Defects 5 2 2 7 Save 4 a. Assuming Janice Sanders is willing to use three-sigma control limits, construct the upper and lower control limits. The UCL, equals and the LCL, equals (Enter your responses rounded to four decimal places. If your answer for LCL, is negative, enter this value as 0.)