

Question: Homework Problems The following data represent the speed at which a ball was hit ( League baseball game in 2018. Complete parts (a) through (f)

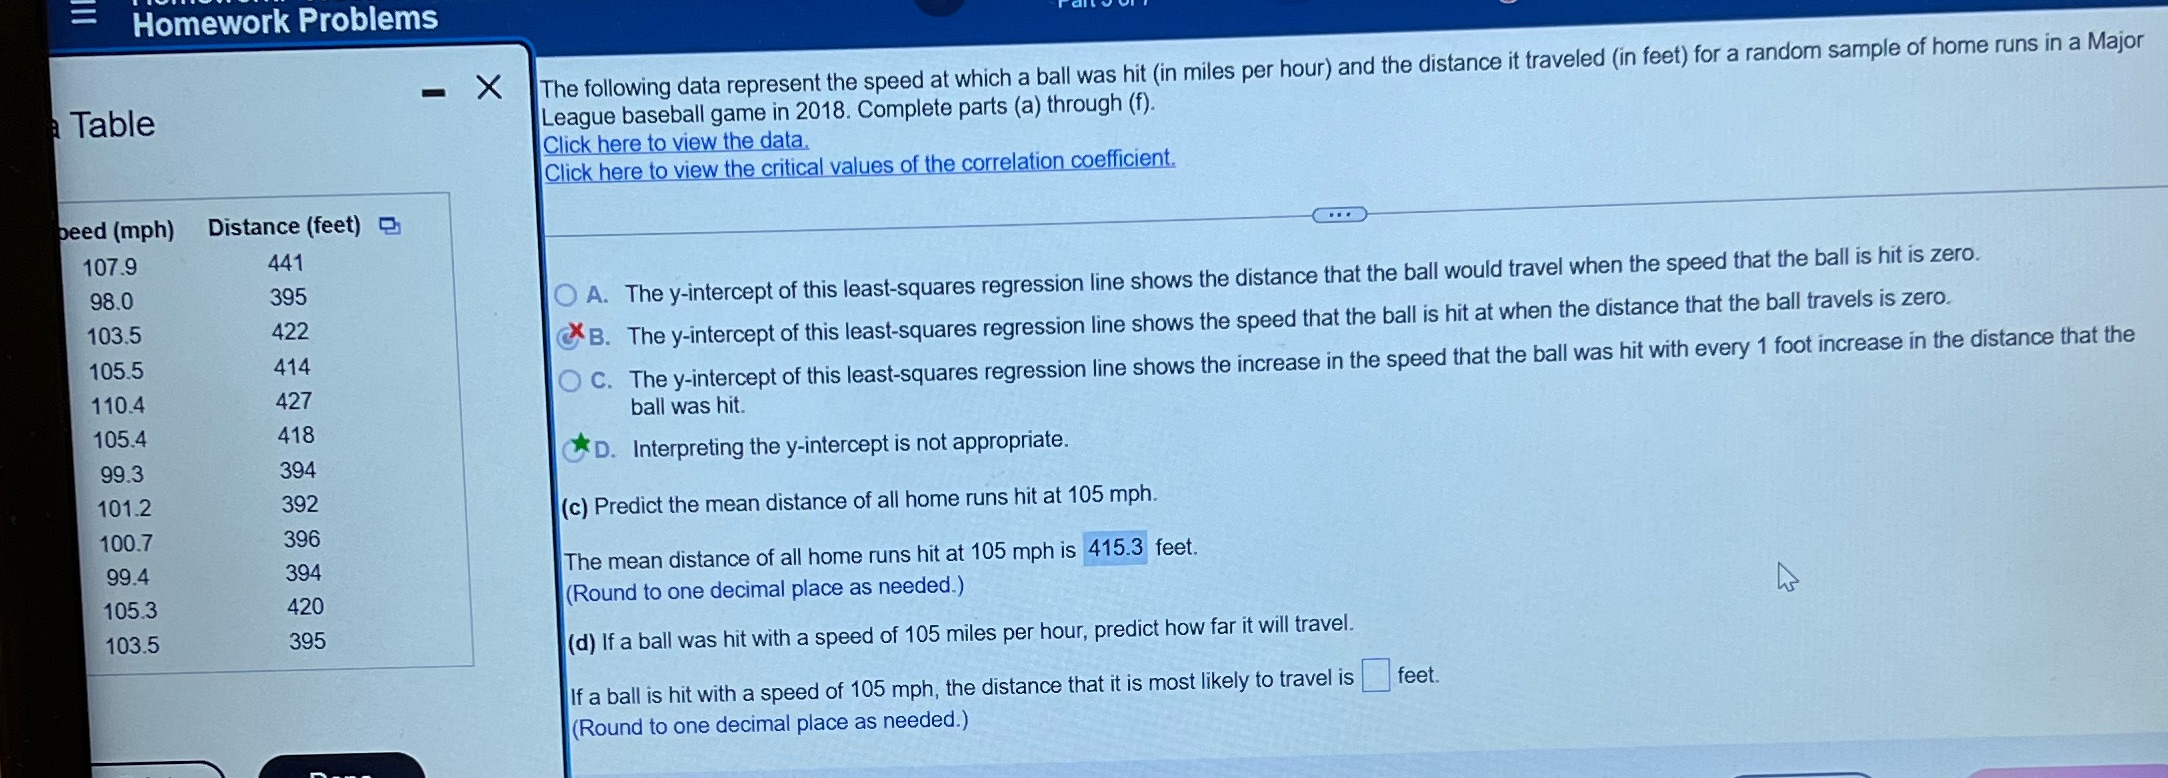
Homework Problems The following data represent the speed at which a ball was hit ( League baseball game in 2018. Complete parts (a) through (f) lit) 0 ' t to rec 'e c' aus re '0 e c in miles per hour) and the distance it traveled (in feel) for a r andom sample of home runs in a Major { ... Distance (feet) I2, 441 ' 395 422 O A. The yintercept of th 414 C:- C. The y-intercept oft :21; i ball was hit. l 394 t * D. interpreting the y-intercept is not appropriate. l 2:: i to) Predict the mean distance of all home runs hit at 105 mph. 394 The mean distance of all home runs hit at 105 mph is 4153 feet. 420 (Round to one decimal place as needed.) (d) if a ball was hit with a speed of 105 miles per hour, predict how far it will travel. If a ball is hit with a speed of 105 mph, the distance that it is most likely to travel is (Round to one decimal place as needed.) is leastsquares regression line shows the distance that the ball would when the distance that the ball travels is zero. (9" B. The y-intercept of this least-squares regression line shows the speed that the ball is hit at e ball was hit with every 1 foot increase in the distance that the his least-squares regression line shows the increase in the speed that in feet. travel when the speed that the ball is hit is zero
Step by Step Solution
There are 3 Steps involved in it

Get step-by-step solutions from verified subject matter experts