

Question: Homework: Section 2.4 Homework Question 10, 2.4.42 HW Score: 29.41%, 5 of 17 points Part 3 of 3 O Points: 0 of 1 Save The
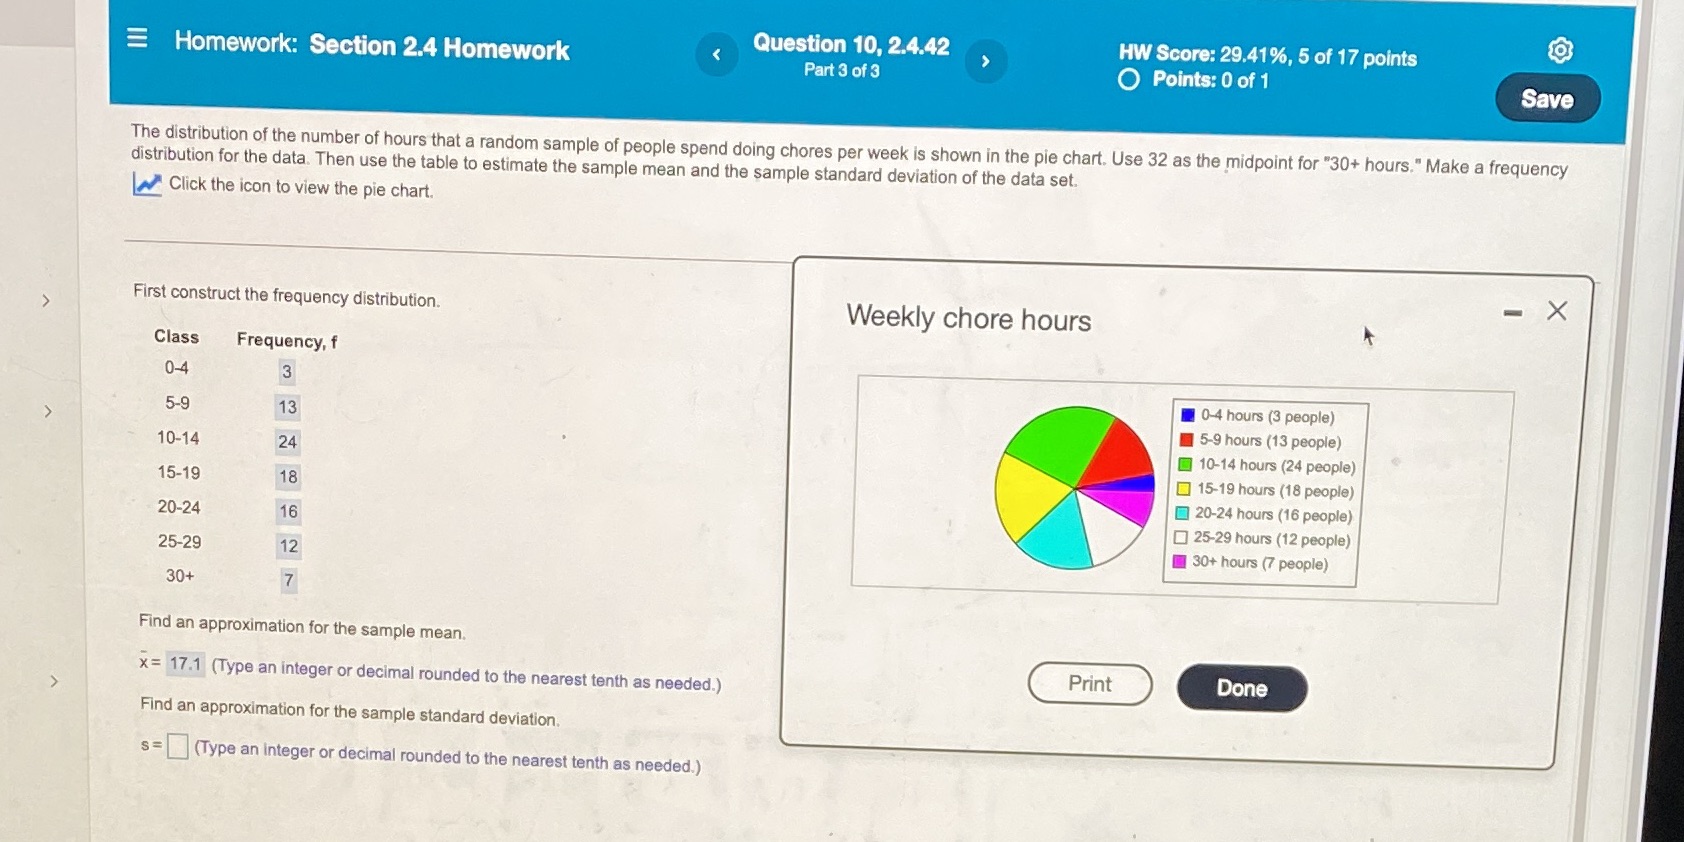
Homework: Section 2.4 Homework Question 10, 2.4.42 HW Score: 29.41%, 5 of 17 points Part 3 of 3 O Points: 0 of 1 Save The distribution of the number of hours that a random sample of people spend doing chores per week is shown in the pie chart. Use 32 as the midpoint for "30+ hours." Make a frequency distribution for the data. Then use the table to estimate the sample mean and the sample standard deviation of the data set. Click the icon to view the pie chart. - X First construct the frequency distribution. Weekly chore hours Class Frequency, f 0-4 3 0-4 hours (3 people) 5-9 13 5-9 hours (13 people) 10-14 24 10-14 hours (24 people) 15-19 15-19 hours (18 people) 18 20-24 hours (16 people) 20-24 16 25-29 hours (12 people) 25-29 12 30+ hours (7 people) 30+ 7 Find an approximation for the sample mean. x= 17.1 (Type an integer or decimal rounded to the nearest tenth as needed.) Print Done Find an approximation for the sample standard deviation. s= (Type an integer or decimal rounded to the nearest tenth as needed.)
Step by Step Solution
There are 3 Steps involved in it

Get step-by-step solutions from verified subject matter experts