

Question: Homework: Section Question 8, 3.2.37 Homework: Section 3.2 Question 8, 3.2.37 Part 1 of 2 HW Score: 35%, 7 of 20 points Score: O of
Homework: Section Question 8, 3.2.37
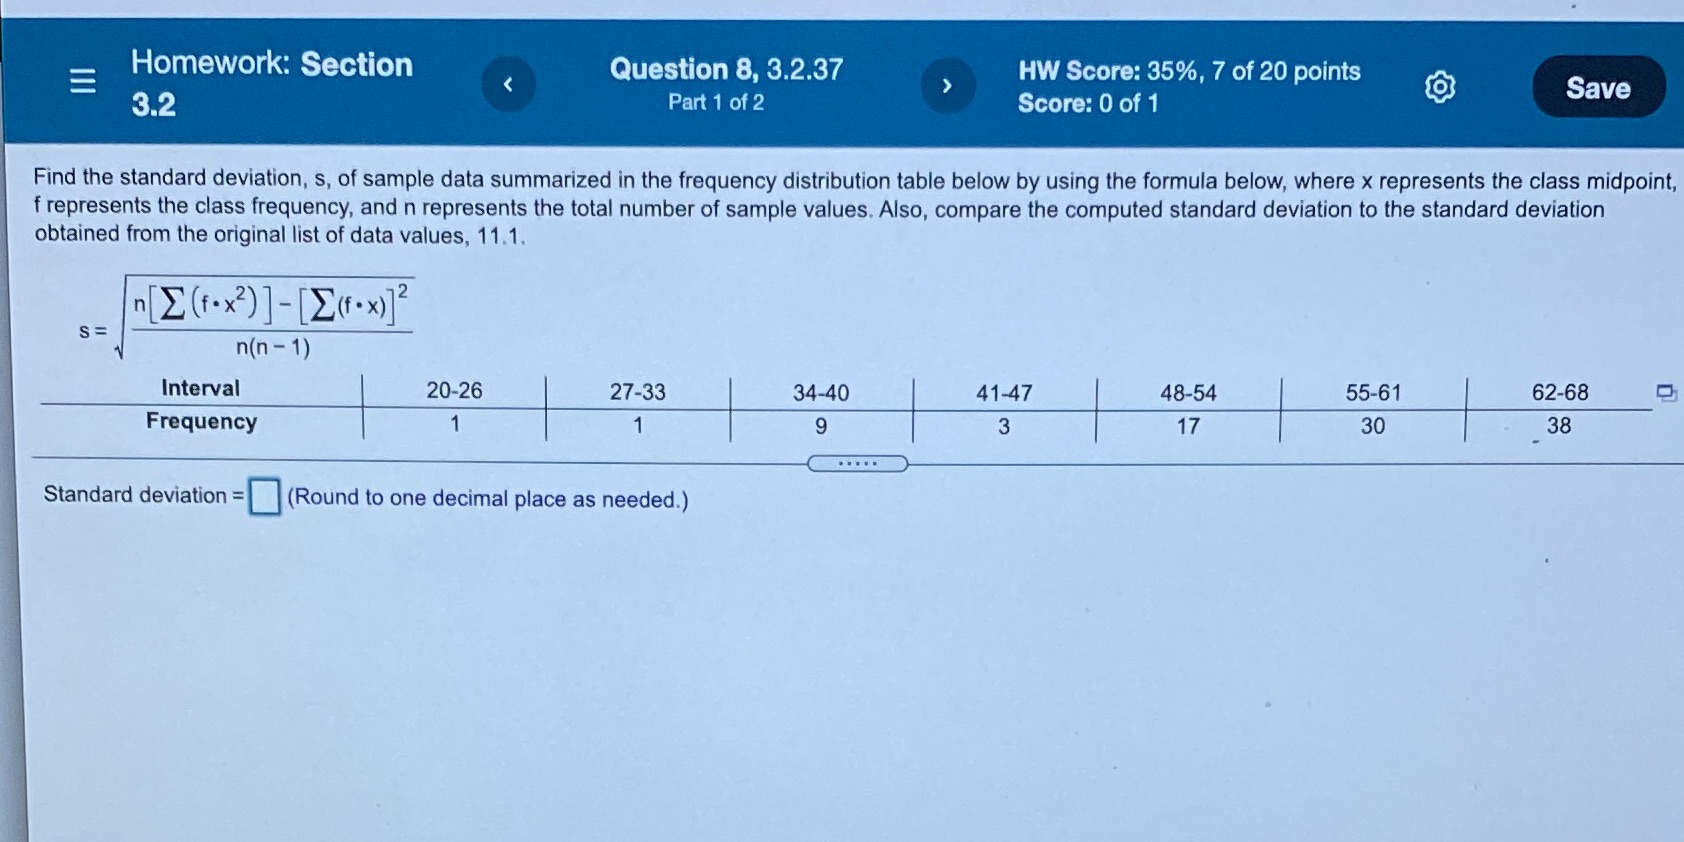
Homework: Section 3.2 Question 8, 3.2.37 Part 1 of 2 HW Score: 35%, 7 of 20 points Score: O of 1 Save Find the standard deviation, s, of sample data summarized in the frequency distribution table below by using the formula below, where x represents the class midpoint, f represents the class frequency, and n represents the total number of sample values. Also, compare the computed standard deviation to the standard deviation obtained from the original list of data values, 11.1. Interval Frequency 20-26 1 27-33 1 34-40 9 41-47 3 48-54 17 55-61 30 62-68 38 C] (Round to one decimal place as needed.) Standard deviation -
Step by Step Solution
There are 3 Steps involved in it

Get step-by-step solutions from verified subject matter experts