

Question: Homework: Set - Prerequisite Week 7 Homework Question 14, IR.10.61 HW Score: 46.67%, 7 of 15 points S Part 1 of 2 O Points: 0
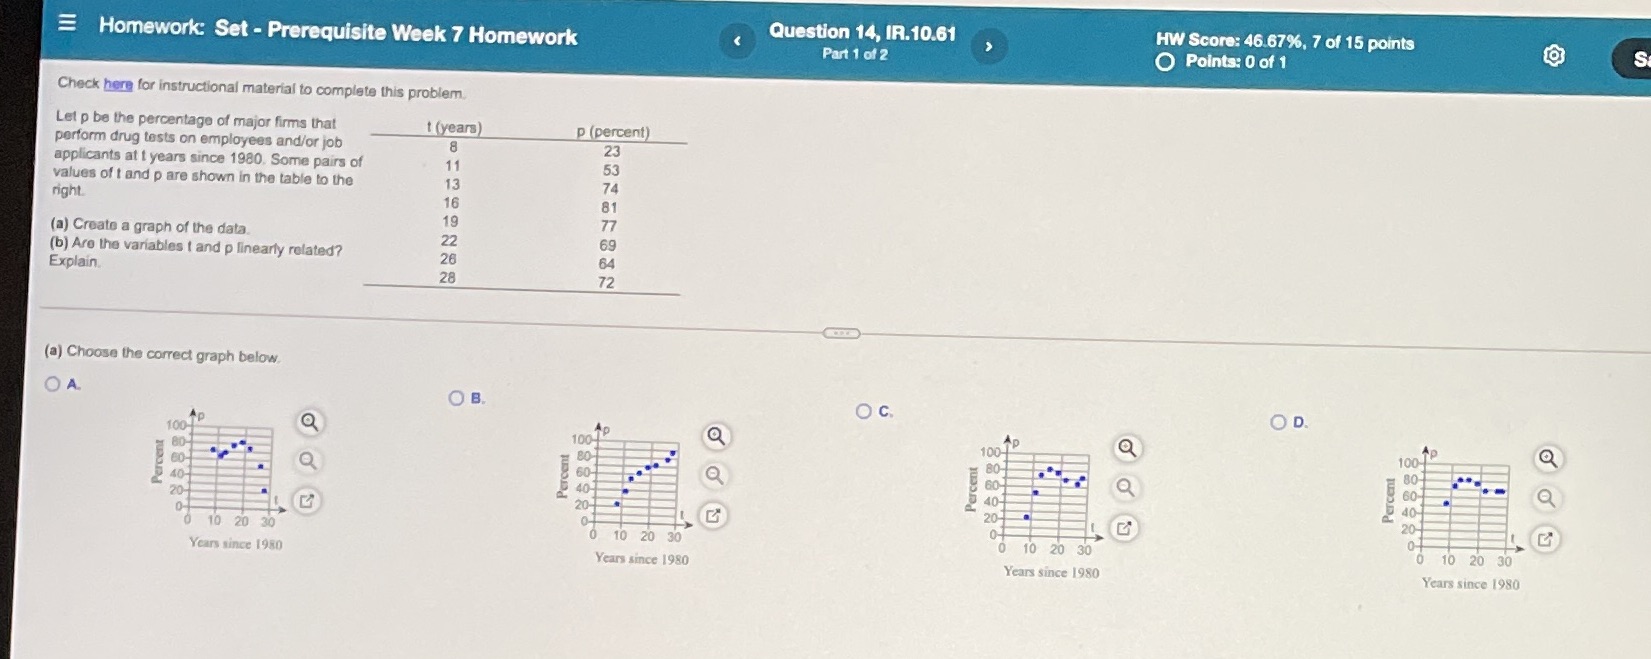
Homework: Set - Prerequisite Week 7 Homework Question 14, IR.10.61 HW Score: 46.67%, 7 of 15 points S Part 1 of 2 O Points: 0 of 1 Check here for instructional material to complete this problem. Let p be the percentage of major firms that 1 (years) p (percent) perform drug tests on employees and/or job 8 23 applicants at t years since 1980. Some pairs of 11 53 values of t and p are shown in the table to the 13 74 right. 16 81 19 77 (a) Create a graph of the data. 22 69 (b) Are the variables t and p linearly related? 26 64 Explain. 28 72 (a) Choose the correct graph below OA O B O c. OD. 100 AP 100- 100- 100- sent Q 80 80- 80 Percent 60- 60- 40- Percent 60 Percent 40- 20- 40- 40- 20 20- 20- 10 20 30 of 0 10 20 30 10 20 30 10 20 30 Years since 1980 Years since 1980 Years since 1980 Years since 1980
Step by Step Solution
There are 3 Steps involved in it

Get step-by-step solutions from verified subject matter experts